
Log Boom Park
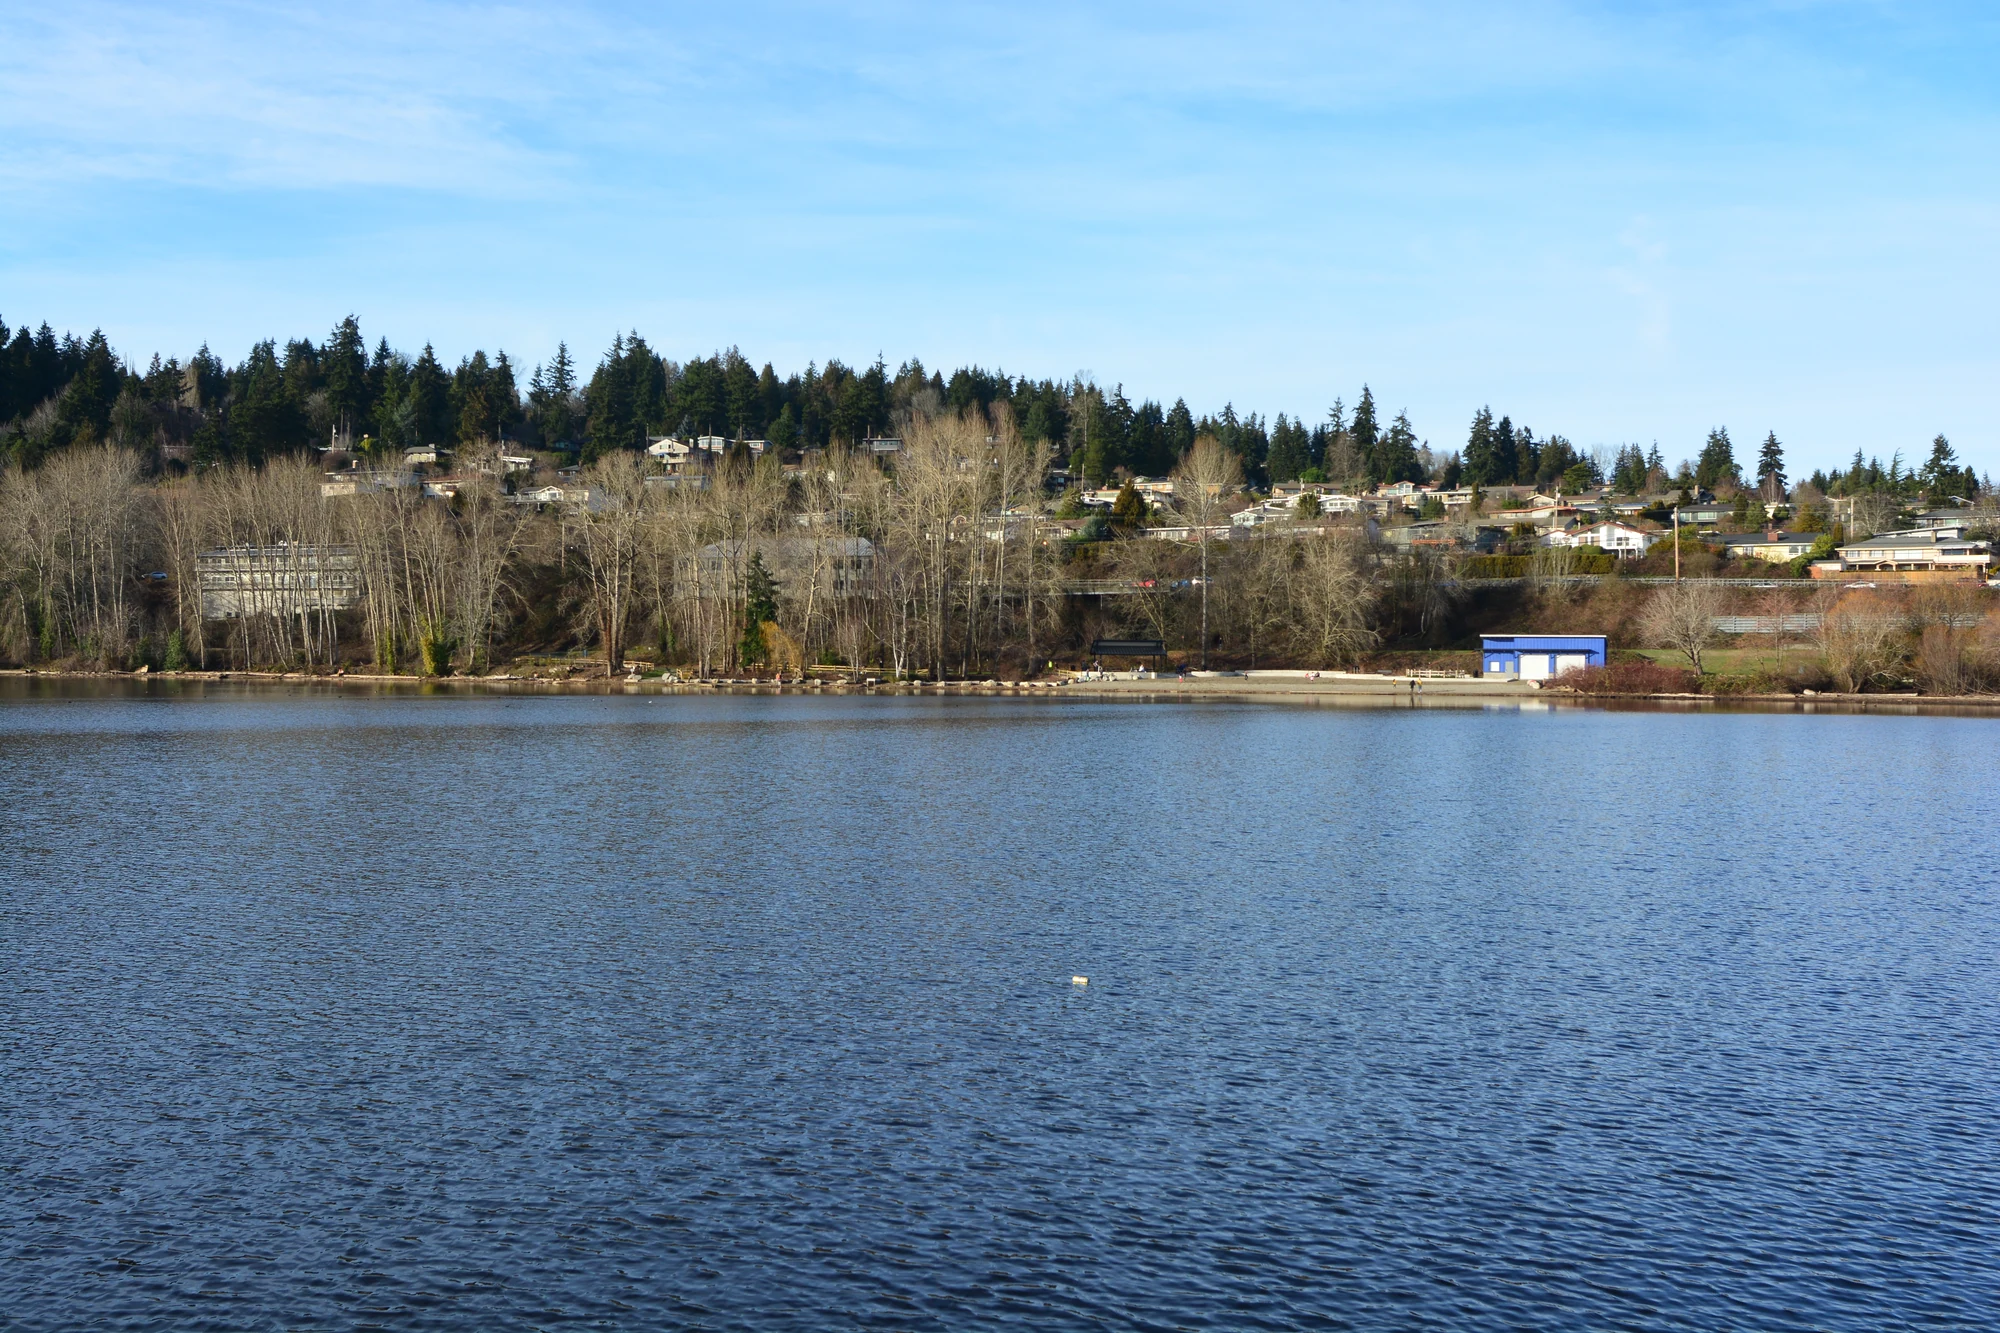
Log Boom Park provides a Lake Washington dock, beach area and access to the Burke-Gilman Trail.
Explore ↗Area guide
Kenmore links Lake Washington access, river recreation and names honoring its Coast Salish setting.
A LOCAL PERSPECTIVE
Loading our transaction map…
No reviewed map positions in this scope. Try another ZIP or city.
Transaction counts follow the selected ZIP or city, which may differ from the reference boundary shown. Dots mark reviewed address positions, not property lines.
The map is temporarily unavailable. Use the full transaction directory or try again later.
 ⓘ
Public school locations are shown for research, not as assigned schools. Confirm attendance, choice-program eligibility and current grades with the district for the exact home address.
Schools located inside the displayed reference boundary
Source: NCES / U.S. Department of Education · 2024-2025 directory. Data & location definitions ↗
HOUSING & EVERYDAY LIFE
Figures cover the named Kenmore geography. U.S. Census Bureau · ACS 2020-2024
Total population · n=23,741
| Group | Estimate | 90% margin |
|---|---|---|
| Under 18 | 4,675 | ± 536.3 |
| 18 to 24 | 1,797 | ± 307.7 |
| 25 to 44 | 7,332 | ± 681.6 |
| 45 to 64 | 5,857 | ± 548.7 |
| 65 and over | 4,080 | ± 524.3 |
Census ACS 2020-2024 · B01001 · Kenmore
Households; annual income in 2024 dollars · n=9,396
| Group | Estimate | 90% margin |
|---|---|---|
| Under $50k | 1,891 | ± 413.5 |
| $50,000 to $99,999 | 1,682 | ± 309.8 |
| $100,000 to $149,999 | 1,380 | ± 285 |
| $150,000 to $199,999 | 1,097 | ± 225 |
| $200k and over | 3,346 | ± 381 |
Census ACS 2020-2024 · B19001 · Kenmore
Housing units · n=9,761
| Group | Estimate | 90% margin |
|---|---|---|
| Detached | 6,123 | ± 384 |
| Attached | 419 | ± 147 |
| Multifamily | 2,912 | ± 515.8 |
| Mobile & other | 307 | ± 169.8 |
Census ACS 2020-2024 · B25024 · Kenmore
Occupied housing units · n=9,396
| Group | Estimate | 90% margin |
|---|---|---|
| Owner-occupied | 6,513 | ± 409 |
| Renter-occupied | 2,883 | ± 383 |
Census ACS 2020-2024 · B25003 · Kenmore
Workers age 16+; includes working from home · n=12,745
| Group | Estimate | 90% margin |
|---|---|---|
| Drive alone | 6,717 | ± 577 |
| Carpool | 722 | ± 208 |
| Public transit | 696 | ± 273 |
| Walk or bike | 281 | ± 135.4 |
| Work from home | 4,233 | ± 531 |
| Other | 96 | ± 70.3 |
Census ACS 2020-2024 · B08301 · Kenmore
ACS five-year estimates describe a multi-year period, not current asking prices or a home valuation. Margins of error use the Census Bureau’s 90% confidence level.
| Measure | Estimate | Margin of error | Statistical universe |
|---|---|---|---|
| Housing units | 9,761 | ± 436 | Housing units |
| Detached homes | 62.7% | ± 2.8 pp | Housing units |
| Owner-occupied homes | 69.3% | ± 3.1 pp | Occupied housing units |
| Median owner-reported home value | $920,800 | ± $28,824 | Owner-occupied housing units; owner-reported value, not a sale price |
| Median gross monthly rent | $1,949 / mo | ± $121 / mo | Cash-rent households; includes applicable tenant-paid utilities |
| Mean one-way commute | 28.8 min | ± 3.4 min | Workers 16+ who travel to work |
U.S. Census Bureau, ACS 2020–2024, retrieved via Census Reporter. Figures cover the entire named statistical geography, including any portion outside King County; the county map is clipped to King County. Derived margins are approximations. Unavailable published margins, including controlled estimates, remain unavailable. ZIP figures describe Census ZCTAs; CDPs are statistical areas, not municipalities.
Open Census source data ↗ Census Reporter data mirror ↗Reviewed 2026-11-14
THE EVERYDAY DETAILS
Log Boom Park provides a Lake Washington dock, beach area and access to the Burke-Gilman Trail.
Explore ↗Rhododendron Park combines a public hybrid-rhododendron collection with paths to the Sammamish River and Kenmore Boathouse.
Explore ↗In 2021, Kenmore renamed Squire’s Landing Park using the Lushootseed village name associated with present-day downtown.
Explore ↗EPA 2021 index at the reference point: Kenmore boundary reference point. These are the reference point’s Census block group ranks, not a score for every home or the whole neighborhood.
This guide describes Kenmore and named local destinations; municipal, postal, park and school boundaries are separate.
Log Boom Park provides a Lake Washington dock, beach area and access to the Burke-Gilman Trail.
Rhododendron Park combines a public hybrid-rhododendron collection with paths to the Sammamish River and Kenmore Boathouse.
In 2021, Kenmore renamed Squire’s Landing Park using the Lushootseed village name associated with present-day downtown.
Walk the routes you would use, visit at different times and compare the details at each property. A neighborhood overview cannot replace seeing the actual home.
No. Neighborhood names and official planning areas may differ. Use the cited sources and the specific parcel when a boundary matters.
No. Check the property address directly with the relevant district. Proximity to a campus is not a guarantee of enrollment.
Contact Ryan with your area, timeline and priorities. This guide describes the area; check current listings separately.
A personal perspective
Tell us the places you are considering and the questions you want to answer.
FROM THE JOURNAL
Pair this local guide with these broader home-buying perspectives, then verify the details for a specific address. Historical reports describe their original publication period.
Bellevue, Kirkland or Redmond? Compare the route, not just the city How to verify school assignment for an Eastside homeYOUR NEXT STEP
A conversation about your priorities, your timing and the questions that matter.
Photographs are credited individually below. Each image keeps its stated license; the image license does not apply to the entire website.