
Xceed Journal
Ignore the Noise: The Truth About Seattle Real Estate in 2026
Historical report. Figures and outlook refer to the original publication period.
On this page
If you follow the headlines, or the general sentiment on social media, you might believe the Seattle real estate market spent the latter half of 2025 in a freefall. It is a common narrative: inventory spiked, interest rates fluctuated, and buyer activity cooled as the year came to a close. However, anecdotal evidence often fails to capture the full picture.
As a data driven realtor - Ryan Xu, my approach is different. I don't rely on "feeling"; I rely on hard numbers. When we strip away the noise and look strictly at the data from King County, Snohomish County, and Pierce County counties, a different, more nuanced story emerges.
The reality of 2025 was not a crash, but a return to a classic, albeit volatile, seasonal cycle. As the Ryan Xu, #1 in Washington State by Closed Sales Volume · RealTrends Verified 2025, I have analyzed this year's unique trends to help you understand where we have been and, more importantly, where we are going in 2026.
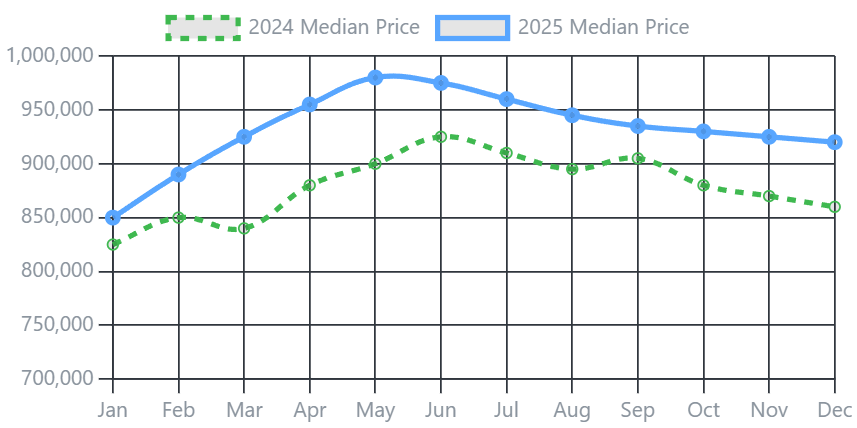
Caption: King County median prices (blue line) remained resilient, consistently outperforming 2024 levels with a peak near $980k.
The King County Paradox: High Inventory, Higher Prices
One of the most surprising data points of 2025 is the disconnect between inventory and price appreciation in King County.
In the middle of the year, particularly around July and August, we saw a massive surge in active listings. Inventory levels hovered around 3,200 units, significantly higher than the previous year. Conventionally, economics 101 tells us that when supply skyrockets and demand remains steady, prices should drop.
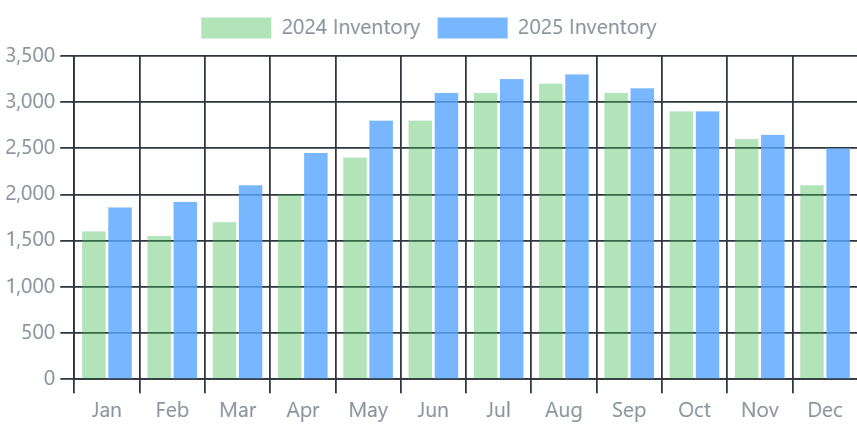
Caption: 2025 saw a noticeable spike in inventory (blue bars) compared to 2024 (green bars), yet prices held firm.
However, the market defied simplicity. Despite this influx, King County closed the year with a solid price growth of roughly 6%.
How is this possible? The answer lies in the "Return to Office" (RTO) mandates. With Amazon enforcing strict RTO policies and Microsoft tightening in-office requirements, demand for housing near Bellevue, Redmond, and South Lake Union remained robust. While remote-work homes sold off, core demand near job centers kept the price floor high.
The Tale of Three Counties: Snohomish County Leads the Pack
While King County showed resilience fueled by tech, the neighboring counties told fascinating stories of their own. The data reveals a clear winner in appreciation this year: Snohomish County.
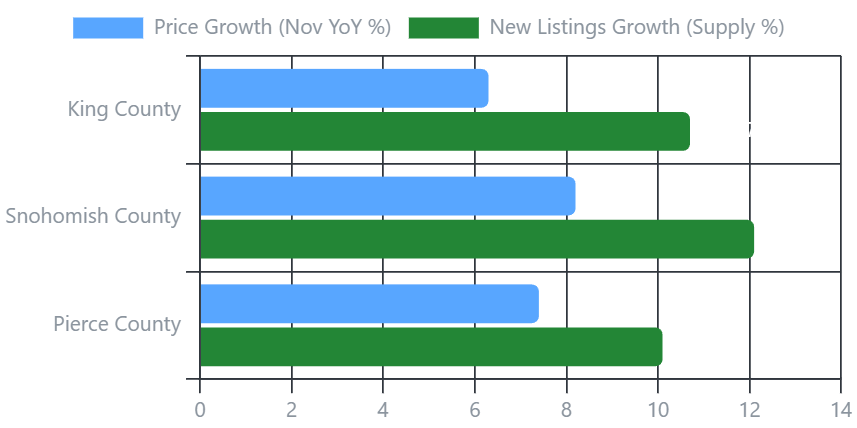
Caption: Surpassing expectations, Snohomish County led the region with over 8% price growth, outperforming both King County and Pierce County.
Snohomish County: The "Comeback Kid"
Contrary to early fears, Snohomish County did not falter; it surged. The data shows it achieved the highest year-over-year price growth in the region at approximately 8.2%, despite also having the highest growth in new listings.
This performance is a textbook example of an "oversold bounce." After being undervalued in the previous cycle, the market corrected sharply upward. A major catalyst for this confidence was the resolution of the Boeing union negotiations. The new deal brought certainty back to the region's largest employer. Rather than a headwind, the stability of the new contract acted as a green light for buyers who had been sitting on the sidelines, fueling a robust recovery that absorbed the 12% increase in supply.
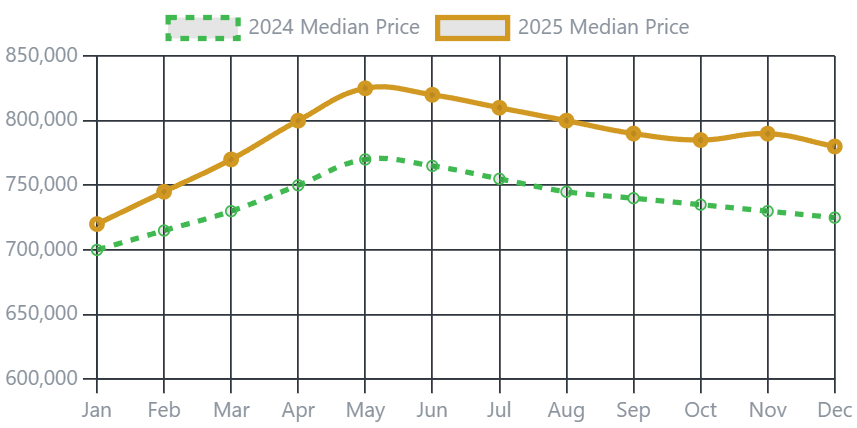
Caption: The 2025 median price curve (gold line) for Snohomish County consistently stayed well above the 2024 trend (dotted green line), illustrating a strong rebound.
Pierce County: Stability in the South
Pierce County remained the "steady eddy" of the region. It posted a healthy 7.5% price growth, supported by a roughly 10% increase in supply.
Anchored by Tacoma, this market is less volatile due to a buyer pool heavily influenced by military and government employment. These incomes tend to rise steadily with CPI adjustments. Tacoma’s revival, marked by reduced crime rates and improved city planning, continues to make it an attractive, affordable alternative to the northern hubs.
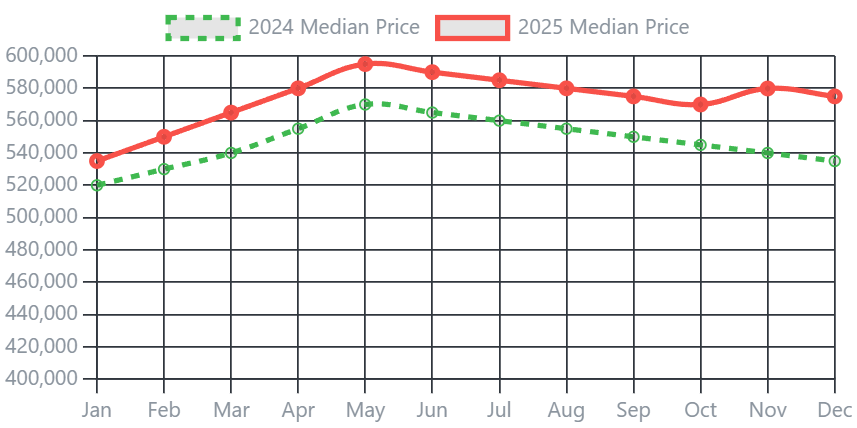
Caption: Pierce County maintained a stable trajectory with prices peaking near $595k, showing consistent demand throughout the year.
Mastering Seasonality: Timing is Everything
If you take only one thing away from this analysis, let it be the importance of seasonality in Seattle real estate. The data from 2025 reinforces a pattern I have tracked for years: May is the peak; December is the trough.
In King County, the median price peaked in May at roughly $980,000 and cooled to around $920,000 by December. That is a significant difference for the exact same asset class.
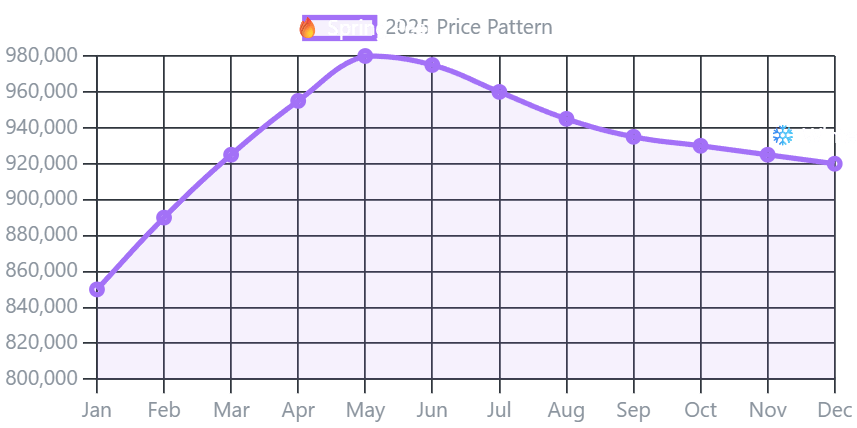
Caption: The "Seasonality Curve" highlights the opportunity gap. Buying in the "Winter Freeze" can mean significant savings compared to the spring peak.
This is why I advise my clients that Ryan Sells over $150M value properties yearlly since 2020 by adhering to strict timing strategies:
-
Sellers: Your window is March through June. Listing after September often means selling at a discount.
-
Buyers: The "winter freeze" (November through January) is your golden window. Prices are at their annual bottom, and competition is scarce.
The Investment Verdict: Appreciation over Cash Flow
A common question I receive is whether to invest in real estate or the stock market. In the current high-interest environment, achieving positive cash flow on a rental property in the Greater Seattle area is challenging.
However, viewing real estate strictly through a cash-flow lens is a mistake in this region. The value here is equity growth.
With Snohomish County delivering over 8% growth and King County delivering 6%, the leverage provided by real estate often outperforms other asset classes when risk-adjusted. Real estate here acts as a leveraged bet on the region's economic engines, Tech and Aerospace, but with the added utility of housing and tax benefits.
Looking Ahead to 2026
Why am I bullish on early 2026?
History tells us that inventory usually bottoms out in December. Currently, we are seeing inventory levels dip as we close the year. We are entering the new year with leaner inventory than the summer peak.
Furthermore, macroeconomic trends suggest a "loosening" of monetary policy in the coming year. If the Federal Reserve moves to inject liquidity to support the broader economy, we will likely see a sharp upward trajectory in home prices starting as early as February 2026.
Caption: Inventory in Snohomish County (gold bars) remained higher than 2024, yet demand absorbed it aggressively, a bullish signal for 2026.
Final Thoughts
Navigating the Seattle market requires more than just browsing Zillow; it requires interpreting data to predict trends before they happen. Whether you are looking to acquire a primary residence during the winter lull or preparing to list your property for maximum value in the spring, you need a strategy backed by analytics.
I am Ryan Xu, a real estate broker in WA, and my team and I are dedicated to helping you make the smartest financial decisions regarding your real estate portfolio.
Are you ready to position yourself for the 2026 spring market?
Search "Seattle Real Estate Agent Ryan Xu" to connect with us today.
Original publication
View the original websiteFROM READING TO EXPLORING
Explore these communities
Use these local guides to take the article’s questions into your own research. An article’s findings do not describe every home in these communities.
Compare neighborhoods on the map ↗CONTINUE THE CONVERSATION
Read next
Compare the past with your next move
The 2025 figures are a historical reference. Talk through the current questions for your property, budget and timing.