
A working landscape with a planning framework
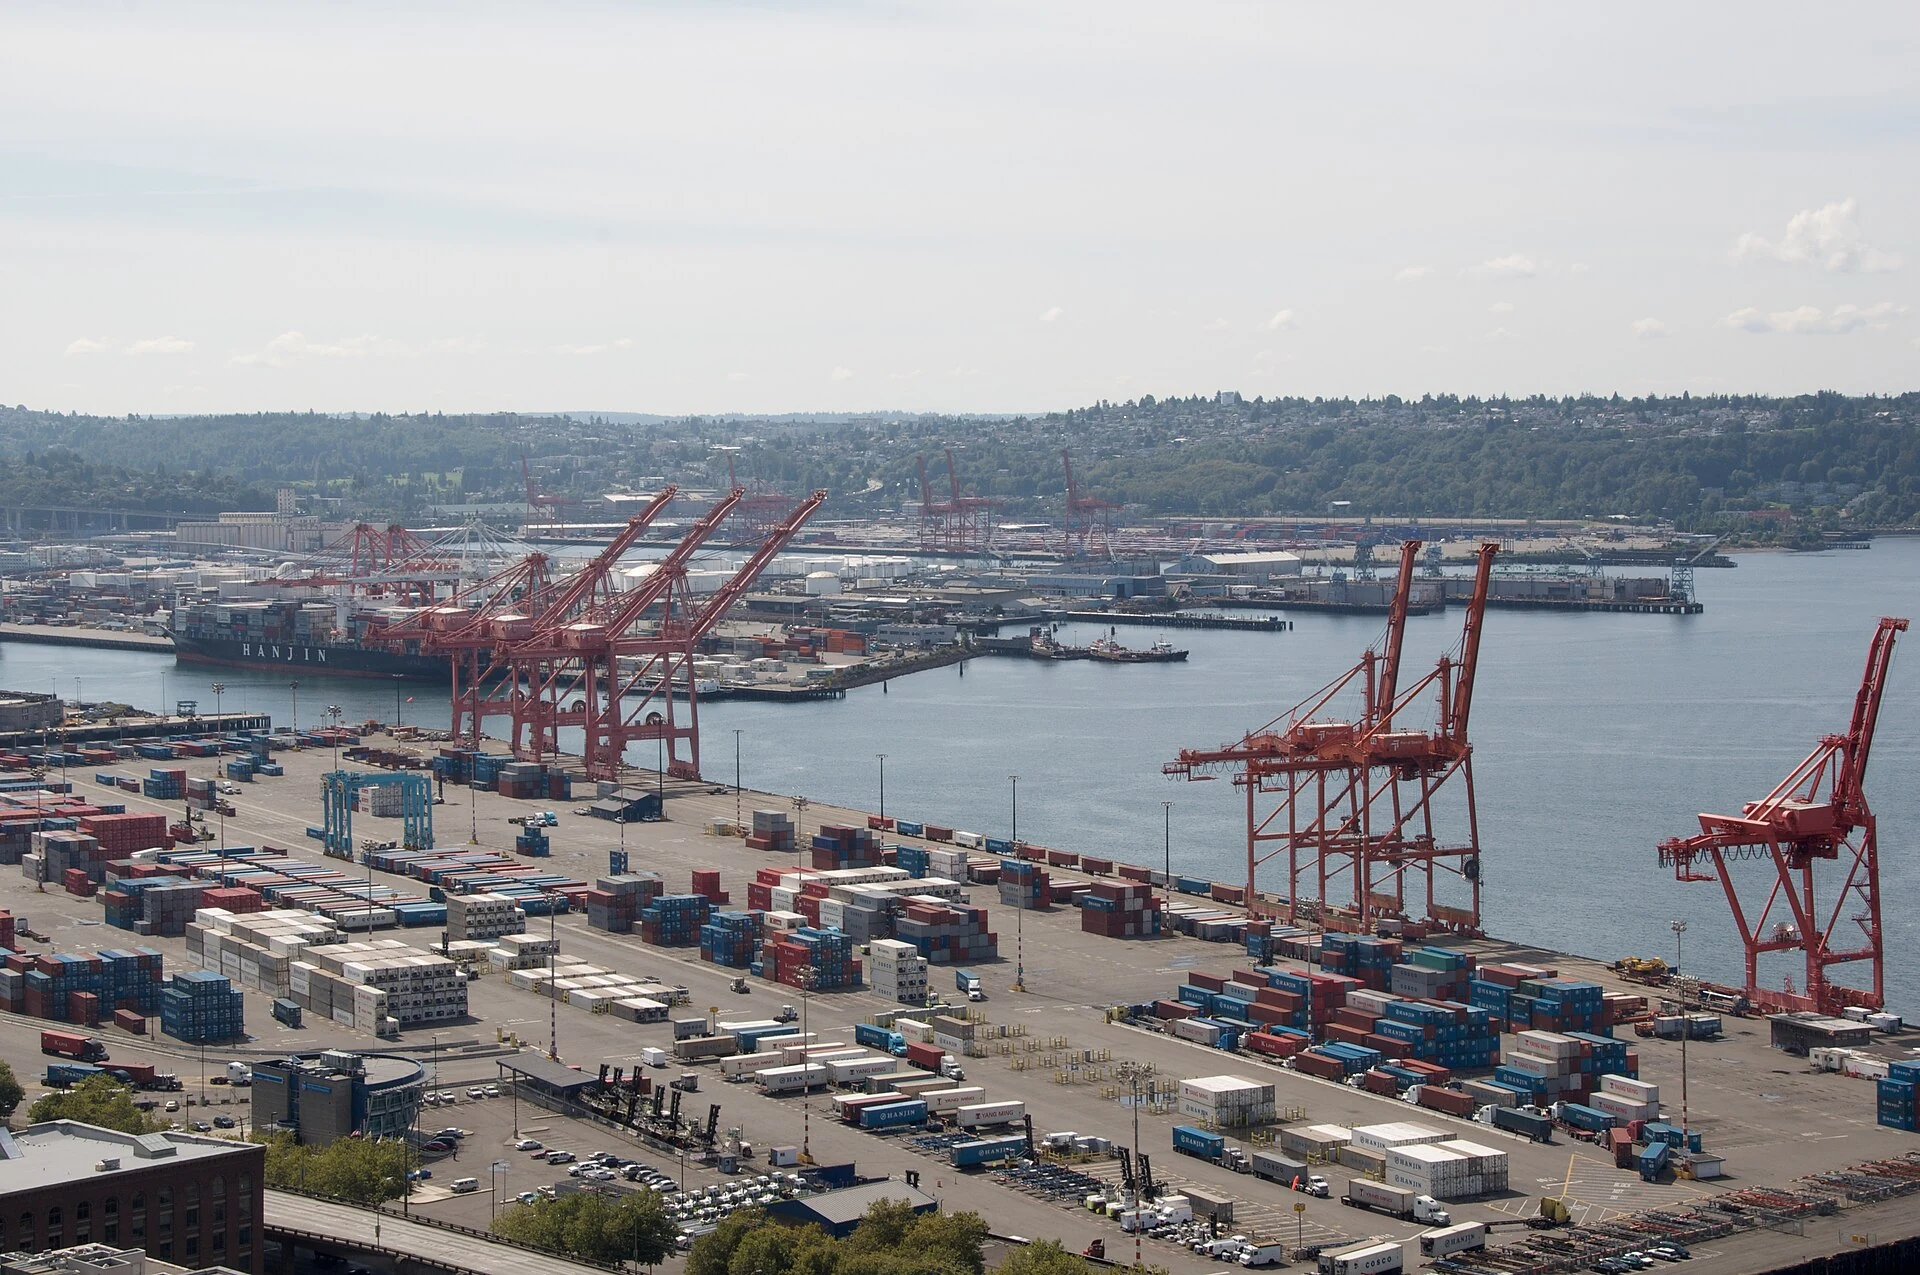
Seattle’s Industrial and Maritime Strategy identifies the Greater Duwamish and Ballard Interbay North manufacturing and industrial centers as important industrial land.
Explore ↗Seattle neighborhood guide
Seattle’s Industrial District is best understood through employment land, port-related movement and transit access rather than a standard residential-neighborhood checklist.
EXPLORE THE AREA
Loading area map…
No reviewed map positions in this scope. Try another ZIP or city.
Explore sourced neighborhood boundaries.
The map is temporarily unavailable. Use the neighborhood directory or try again later.
Public school locations are shown for research, not as assigned schools. Confirm attendance, choice-program eligibility and current grades with the district for the exact home address.
Nearby schools in the reference point’s district: Seattle Public Schools
Separate eligibility or application requirements may apply.
Nearby schools in the reference point’s district: Seattle Public Schools
Separate eligibility or application requirements may apply.
Nearby schools in the reference point’s district: Seattle Public Schools
Separate eligibility or application requirements may apply.
Source: NCES / U.S. Department of Education · 2024-2025 directory. Data & location definitions ↗
HOUSING & EVERYDAY LIFE
These figures describe Seattle as a whole, not Industrial District specifically. U.S. Census Bureau · ACS 2020-2024
Total population · n=754,195
| Group | Estimate | 90% margin |
|---|---|---|
| Under 18 | 103,823 | ± 2,514.7 |
| 18 to 24 | 75,263 | ± 2,304.4 |
| 25 to 44 | 315,407 | ± 3,943.5 |
| 45 to 64 | 161,506 | ± 2,797 |
| 65 and over | 98,196 | ± 2,327.2 |
Census ACS 2020-2024 · B01001 · Seattle
Households; annual income in 2024 dollars · n=363,466
| Group | Estimate | 90% margin |
|---|---|---|
| Under $50k | 76,795 | ± 2,494.7 |
| $50,000 to $99,999 | 75,601 | ± 2,587.1 |
| $100,000 to $149,999 | 57,787 | ± 1,808.7 |
| $150,000 to $199,999 | 42,863 | ± 1,752 |
| $200k and over | 110,420 | ± 2,023 |
Census ACS 2020-2024 · B19001 · Seattle
Housing units · n=393,918
| Group | Estimate | 90% margin |
|---|---|---|
| Detached | 144,993 | ± 2,130 |
| Attached | 24,171 | ± 1,154 |
| Multifamily | 223,737 | ± 3,680.2 |
| Mobile & other | 1,017 | ± 227 |
Census ACS 2020-2024 · B25024 · Seattle
Occupied housing units · n=363,466
| Group | Estimate | 90% margin |
|---|---|---|
| Owner-occupied | 158,945 | ± 2,000 |
| Renter-occupied | 204,521 | ± 2,822 |
Census ACS 2020-2024 · B25003 · Seattle
Workers age 16+; includes working from home · n=458,144
| Group | Estimate | 90% margin |
|---|---|---|
| Drive alone | 167,910 | ± 3,193 |
| Carpool | 21,609 | ± 1,657 |
| Public transit | 54,597 | ± 2,240 |
| Walk or bike | 48,452 | ± 2,406.8 |
| Work from home | 159,285 | ± 3,291 |
| Other | 6,291 | ± 817 |
Census ACS 2020-2024 · B08301 · Seattle
ACS five-year estimates describe a multi-year period, not current asking prices or a home valuation. Margins of error use the Census Bureau’s 90% confidence level.
| Measure | Estimate | Margin of error | Statistical universe |
|---|---|---|---|
| Housing units | 393,918 | ± 2,085 | Housing units |
| Detached homes | 36.8% | ± 0.5 pp | Housing units |
| Owner-occupied homes | 43.7% | ± 0.5 pp | Occupied housing units |
| Median owner-reported home value | $938,600 | ± $8,494 | Owner-occupied housing units; owner-reported value, not a sale price |
| Median gross monthly rent | $2,030 / mo | ± $22 / mo | Cash-rent households; includes applicable tenant-paid utilities |
| Mean one-way commute | 26 min | ± 0.6 min | Workers 16+ who travel to work |
U.S. Census Bureau, ACS 2020–2024, retrieved via Census Reporter. Figures cover the entire named statistical geography, including any portion outside King County; the county map is clipped to King County. Derived margins are approximations. Unavailable published margins, including controlled estimates, remain unavailable. ZIP figures describe Census ZCTAs; CDPs are statistical areas, not municipalities.
Open Census source data ↗ Census Reporter data mirror ↗Reviewed 2026-11-14
THE EVERYDAY DETAILS
Seattle’s Industrial and Maritime Strategy identifies the Greater Duwamish and Ballard Interbay North manufacturing and industrial centers as important industrial land.
Explore ↗Sound Transit lists SODO Station at 500 S Lander Street, with platforms, ticket machines and bicycle parking.
Explore ↗EPA 2021 index at the reference point: Industrial District boundary reference point. These are the reference point’s Census block group ranks, not a score for every home or the whole neighborhood.
The displayed City of Seattle atlas boundary is an unofficial neighborhood reference. Nearby facilities are identified as nearby where relevant; property lines, public access and school assignments must be checked separately.
4Culture’s SODO Track project transformed industrial building backs along 5th Avenue S, between Royal Brougham Way and S Spokane Street. Its 2018 program described a two-mile mural corridor involving more than 60 artists around motion, speed and progress. This arts project adds a cultural layer to a district otherwise shaped by industry and transport.
Seattle’s Industrial and Maritime Strategy identifies the Greater Duwamish and Ballard Interbay North manufacturing and industrial centers as important industrial land. The official page describes subarea planning work, not a guarantee of any parcel’s future use. For this district, the relationship between industry, goods movement and surrounding streets is central to understanding the area.
Sound Transit lists SODO Station at 500 S Lander Street, with platforms, ticket machines and bicycle parking. It does not provide a Sound Transit parking facility at the station. Use the actual pedestrian approach and current service information when considering access; the presence of a rail stop does not make the surrounding industrial streets a residential enclave.
 ⓘ
Walk the routes you would use, visit at different times and compare the details at each property. A neighborhood overview cannot replace seeing the actual home.
No. Neighborhood names and official planning areas may differ. Use the cited sources and the specific parcel when a boundary matters.
No. Check the property address directly with the relevant district. Proximity to a campus is not a guarantee of enrollment.
Contact Ryan with your area, timeline and priorities. This guide describes the area; check current listings separately.
A personal perspective
Tell us the places you are considering and the questions you want to answer.
FROM THE JOURNAL
Pair this local guide with these broader home-buying perspectives, then verify the details for a specific address. Historical reports describe their original publication period.
Which Way Should a Seattle Home Face? Eight Backyard Orientations and 21 Years of Weather DataYOUR NEXT STEP
A conversation about your priorities, your timing and the questions that matter.
Photographs are credited individually below. Each image keeps its stated license; the image license does not apply to the entire website.