
Xceed Journal
Which Way Should a Seattle Home Face? Eight Backyard Orientations and 21 Years of Weather Data
On this page
Which Direction Should a Seattle Home Face? Eight Backyard Orientations Calculated Using 21 Years of Weather Data
The author, Ryan Xu, known as Seattle Lao Xu on YouTube and Xiaohongshu, is the founder and a broker at Bellevue-based Xceed Realty, serving Greater Seattle Eastside. This article accompanies the YouTube video of the same name and adds data that could not fit into the video.
Short answer: For Seattle homebuyers, rank the backyard orientation in five tiers. Southwest is the best overall.
If you are buying in Seattle or Greater Seattle Eastside and want one takeaway:
Start by asking which side of the house you mean. Look at the direction the backyard-facing wall faces, rather than the front door. In common Seattle and Eastside floor plans, garages occupy much of the front elevation and contribute no daylight to the living space. The largest expanse of glazing generally belongs to the open Great Room at the rear.
Ranking by backyard orientation puts the eight directions into five tiers:
| Tier | Orientation |
|---|---|
| Tier 1 | Southwest SW |
| Tier 2 | West W |
| Tier 3 | South S · Southeast SE |
| Tier 4 | Northwest NW · East E |
| Tier 5 | North N · Northeast NE |
Why southwest ranks first overall: The two measures point in different directions. For total annual sunlight, south leads, with southwest only 4.4 points behind. For the three hours starting at 5 p.m. (April through September, local hours 17, 18 and 19), west takes first place, while south receives only 15% of west's evening total. Those evening hours are precisely when most people actually spend time in their yards.Southwest is therefore the only orientation that performs well on both measures: It receives 95.6% of south's annual total and 4.7 times south's evening total. The complete indices and tiers appear below.
All eight orientations: annual total, evening sunlight and tier
| Orientation | Annual sunlight index (South = 100) | Evening sunlight index (West = 100) | Tier | One-sentence assessment |
|---|---|---|---|---|
| Southwest SW | 95.6 | 72 | Tier 1 | The all-rounder, with no major trade-off between the two measures |
| West W | 74.5 | 100 | Tier 2 | Strongest evening exposure of all eight directions, but annual sunlight falls to roughly three-quarters of south's total |
| South S | 100 | 15 | Tier 3 | Highest annual total, but its advantage comes at midday, when you may be away. The benefit is easier lawn and yard upkeep |
| Southeast SE | 93.2 | 7 | Tier 3 | An excellent annual total, but almost no direct evening sun |
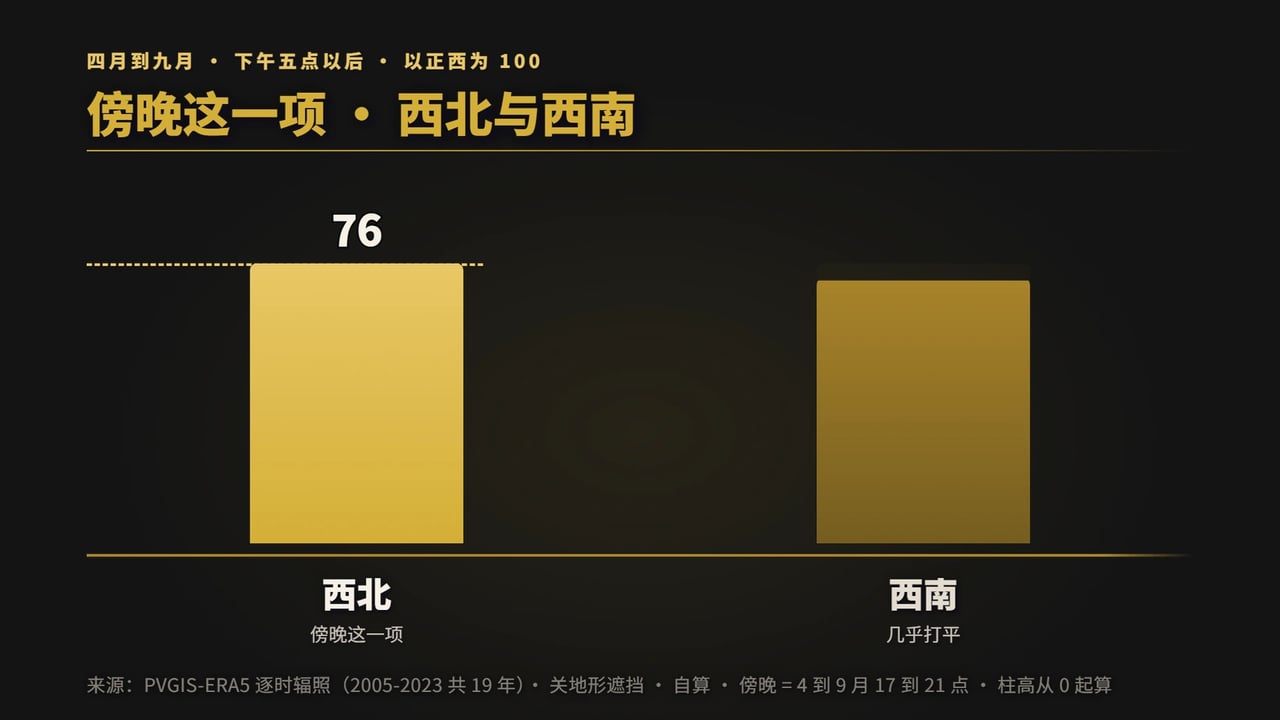
| Northwest NW | 42.9 | 76 | Tier 4 | Second for evening exposure, but only 42.9 annually. The yard is shaded for much of the year |
| East E | 70.8 | 7 | Tier 4 | A reasonable annual total, but only 7 in the evening. Morning is also the cloudiest part of the day |
| Northeast NE | 40.9 | 7 | Tier 5 | Near the bottom on both measures |
| North N | 24.2 | 17 | Tier 5 | Lowest annual total. The north wall receives no direct sun for about 181 days from the autumnal to the vernal equinox. Its evening score of 17 applies only to April through September evenings and provides no basis for claiming that north is better than south. Section 5 explains why |
↔ This table is wide. Swipe horizontally on a phone to see every column
Measurement basis: The annual column uses vertical-wall irradiance from European Commission PVGIS v5.3, PVGIS-ERA5 reanalysis, for the 19 years from 2005 through 2023, with terrain effects disabled. The evening column totals local hours 17, 18 and 19 from April through September.
🔴 Both columns are upper limits: The PVGIS horizon accounts only for terrain elevation, not trees, neighboring houses or eaves. A real property's sunlight equals this upper limit multiplied by a shading discount. That discount often matters more than the difference between orientations.

1. In Seattle, assess the side where you spend your waking hours, rather than the front door
When touring a Seattle home, ask which direction the backyard-facing wall faces, rather than the front door. Floor plans explain why: in typical Eastside layouts, garages occupy much of the front, without windows connecting that side to living spaces, so they contribute no daylight there. The largest and most extensively glazed space is the open Great Room at the rear. NAHB's March 2019 Spaces in New Homes report, based on 153 single-family builders, found that among new homes with a Great Room, 77.2% incorporated the kitchen and 61.4% also included the breakfast nook. The average area exceeded 800 square feet, making it the largest space in the house.People asking about orientation almost always mean the front door. This habit probably comes from the traditional preference for a south-facing home, but Seattle floor plans make it misleading.
In the most popular Eastside layouts, a two- or three-car garage occupies much of the front elevation. That side usually has no window connection to the indoor living spaces, so it contributes no daylight to them. The rest of the front contains the entrance and foyer, typically flanked by an office and formal dining room. Those rooms have windows, but most people do not spend much time in them.
The space used most is the open area at the rear: kitchen, living room and breakfast nook joined without dividing walls, known as the Great Room.
The National Association of Home Builders (NAHB) surveyed 153 single-family builders for its March 2019 Spaces in New Homes report. It found:Among new homes with a Great Room, 77.2% of Great Rooms included the kitchen and 61.4% also included the breakfast nook.
🔴 One point must be clear:The denominator for both percentages is Great Rooms, not all homes. In the video I described the denominator as all homes being built. That was a verbal error, corrected here to match the original source. These two percentages also cannot be multiplied together; they describe two measures using the same base.
Two other figures from that report belong together: only 70.6% of new homes still treated the kitchen as a separate room, falling to 63.4% in homes over 3,500 square feet. Meanwhile, the average Great Room exceeded 800 square feet, making it the home's largest space. Kitchens are being incorporated into that larger room.
NAHB's March 2021 What Home Buyers Really Want report describes demand: 85% of buyers wanted an open kitchen/dining-room connection and 79% wanted the kitchen connected to the family room. Outdoors, the preferences were patio 82%, rear porch 75% and deck 75%.
Kitchen cabinets occupy wall space that cannot accommodate large windows, so the living-room glazing supplies most of the Great Room's daylight.In standard plans from major Puget Sound builders, that glazing generally faces the backyard.
⚠ An important qualification:No industry-wide statistic has been published on the share of new homes with a rear Great Room. We searched NAHB, Census and builders' public materials; the industry does not track that dimension. The statement above describes a common pattern in publicly available plans from several major Puget Sound builders. It is a Grade C judgment based on experience, not a statistical finding.
That is why a Seattle discussion of orientation should focus on the backyard-facing wall rather than the front door.
There is supporting context. A February 2022 poll on the Chinese-language forum 1p3a asked which parts of a home respondents most wanted facing south. Its 359 participants could select up to 4 options, producing 671 votes across eight options. The living room received 197 votes (29.4% of all votes), the master bedroom 170 (25.3%) and backyard/patio 106 (15.8%). The front door/porch/driveway option received only 24 votes, or 3.6% of all votes.
⚠ That 3.6% is the share of votes, not the share of respondents. Even if all 24 votes came from different people, that would be 6.7% of 359 participants. The direction is nevertheless clear: people care most about the living room, primary bedroom and backyard, and very little about the front door. As discussed later, NWMLS's only orientation field records exactly that front door.
2. When you are home, and when Seattle provides sunlight
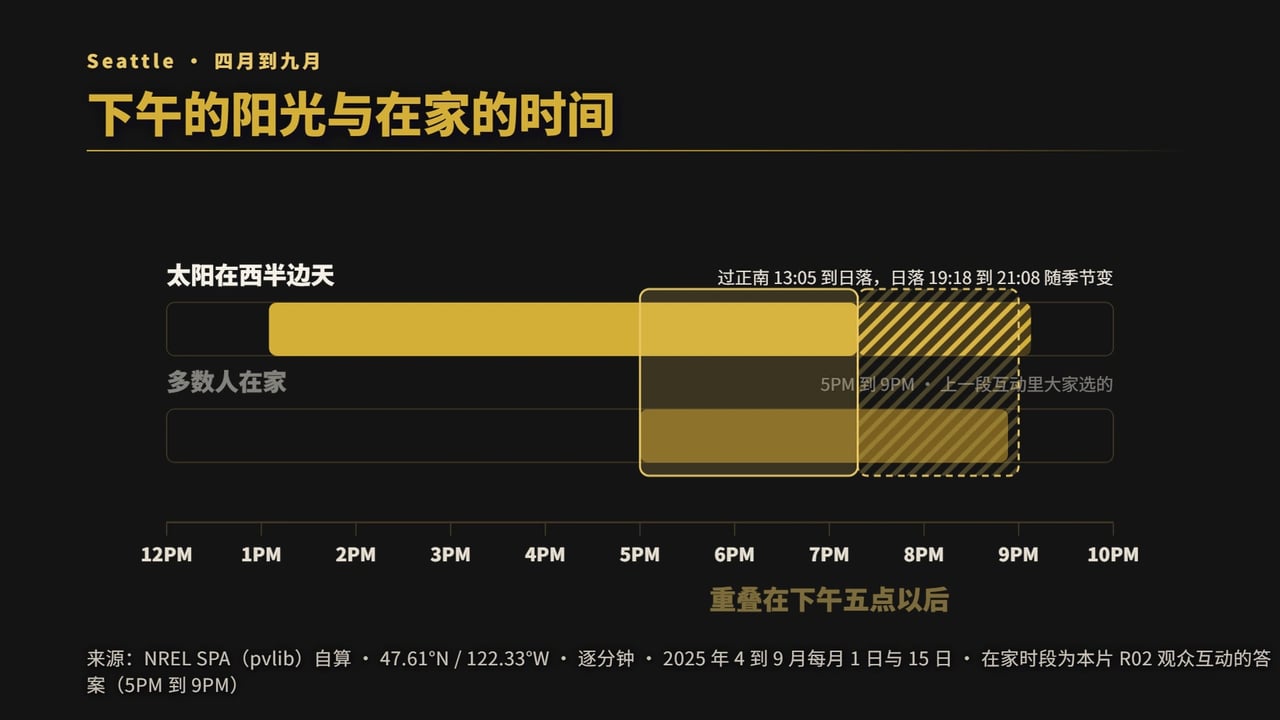
The answer depends on whether your time at home overlaps with Seattle's sunlight. It does: from April through September, sunset ranges from 19:18 in mid-September to 21:08 in late June. Starting at 5 p.m., that leaves at least 2 hours 18 minutes of daylight during these six months. The Bureau of Labor Statistics' 2025 American Time Use Survey (ATUS), released June 25, 2026, reports 2.61 hours/day watching television and 0.71 hours/day cooking and cleaning the kitchen. Most of these activities take place after work. The practical question is therefore whether the yard and living room receive sunlight between 5 and 9 p.m.Orientation has two sides: when you need sunlight, and when the city provides it. The question is properly framed only when those align.
Demand: Most people want the hours after work
In the video, I asked viewers which part of the day they spent most often at home. Most chose 5 p.m. to 9 p.m..
⚠ That was a video interaction, not a statistical result, and this article does not treat it as data.
For a citable proxy, consider the BLS 2025 American Time Use Survey, released June 25, 2026:Watching television: 2.61 hours/day (participation rate 74.3%); cooking and kitchen cleanup: 0.71 hours/day (participation rate 65.2%); socializing and communicating: 0.58 hours; lawn and garden care: 0.19 hours. Most of these activities occur after work.
Table 16-15 of the EPA's 2011 Exposure Factors Handbook provides an unusual room-level breakdown for people aged 16 to 21, in minutes/day: bedroom 588; living room, family room and study combined 157; kitchen 34; bathroom 26; dining room 7. ⚠ The adult table has no living-room row. U.S. official statistics have never published that row, so these figures are only a reference.
Another study (Mitra et al., 2020, Energy and Buildings 210:109713, using 12 years of ATUS data) estimated that during weekday time at home, bedrooms accounted for 54% to 63% and living rooms for 19% to 27%. ⚠ Room use in that study was inferred from activity types, not directly measured.
The conclusion is straightforward:Apart from sleeping, people spend the most time in living spaces, heavily concentrated in the evening.
Supply: When Seattle provides sunlight
From April through September, the sun crosses due south as early as 13:05 (mid-September) and as late as 13:16 (mid-July). Sunset is as early as 19:18 (mid-September) and as late as 21:08 (late June). Starting at 5 p.m., that leaves at least 2 hours 18 minutes of daylight during these six months.
(Solar noon is not 12:00 for two reasons: April through September uses daylight saving time, advancing clocks one hour; and Seattle lies toward the western side of the Pacific time zone, so true solar noon already occurs later than clock noon.)
The correct reading is therefore:Seattle's afternoon and evening sunlight overlaps with the time most people are actually home. The remaining question is whether your yard and living room receive sunlight during those hours.
First, an objection: “It rains more than half the time in Seattle”
I posed this rhetorical objection myself in the video. It sounds factual, but it is not.
Based on 21 years of hourly observations at Sea-Tac Airport (⚠ the station is in SeaTac, about 15 to 25 miles from Bellevue, Kirkland and Redmond across Lake Washington, so this section's findings strictly apply only to the Sea-Tac area), during the rainy season (November through March), only 17.8% to 21.5% of hours record precipitation. During daytime specifically, the rate is 18.62% between 09:00 and 13:00 and 20.34% between 14:00 and 18:00. Afternoon is actually 1.72 percentage points higher. The full-day range is only 3.8 percentage points, calculated from the unrounded 17.77% and 21.53%.
The claim that Seattle has morning rain that stops in the afternoon is therefore unsupported by these data. Seattle's problem is less rain than cloud cover.
3. How cloudy is Seattle? 21 years and 180,000 cloud observations
First, the finding that matters directly for orientation: Seattle's morning sunlight is less dependable than its evening sunlight. East-facing homes receive direct sun only in the morning, and 09:00 is the cloudiest hour of the day. This section also quantifies the familiar local impression of gray mornings and brighter afternoons. The difference is smaller than you may expect. The evidence follows; readers wanting only the conclusions can skip to Section 4.
Seattle's central issue is cloud cover rather than rain. Iowa State University's Environmental Mesonet ASOS archive for KSEA (Seattle-Tacoma International Airport) contains 183,674 usable observations over 21 years, January 1, 2005 through December 30, 2025:During rainy-season daylight hours from November through March, heavy cloud cover occurs 79% to 86% of the time, while completely clear skies occur only 2% of the time. By comparison, only 17.8% to 21.5% of rainy-season hours record precipitation. (⚠ The station is in SeaTac, about 15 to 25 miles from Bellevue, Kirkland and Redmond across Lake Washington. This section's findings strictly apply only to the Sea-Tac area.)The following is this article's original statistical analysis, which the author did not find elsewhere online. First, the measurement definitions.
Seattle cloud data: 21 years and 180,000 records from Sea-Tac Airport
The source is Iowa State University's Environmental Mesonet ASOS archive, station KSEA (Seattle-Tacoma International Airport, 47.4444 N / 122.3139 W), parameter report_type=3, covering January 1, 2005 through December 30, 2025, a total of 21 years. It returned 183,690 rows, of which 183,674 observations were usable.
⚠ An essential limitation: These figures come from Sea-Tac Airport's weather station, approximately 15 to 25 miles from Bellevue, Kirkland and Redmond, with Lake Washington between them. The Puget Sound convergence zone, where two airflows passing around the Olympic Mountains meet over north King County and generate clouds and rain, can produce cloud conditions in north King County and south Snohomish County that differ substantially from Sea-Tac. These findings strictly apply only to the Sea-Tac area. Eastside microclimates were not validated in this round; that would require triangulation using Boeing Field, Paine Field and Renton stations.


During rainy-season daylight, heavy cloud cover occupies about four-fifths of the time
(Here are the six weather codes used in this section, from cloudiest to clearest: VV means fog or low cloud so dense that the cloud base cannot be seen; OVC means an overcast sky; BKN means clouds cover most of the sky but leave gaps. The first three together are described here as a sky without a visible patch of blue. SCT means scattered clouds; FEW means just a few clouds; and CLR means clear skies. The last two together are what this article calls “mostly clear.”)
During the rainy months of November through March, for 79% to 86% of daylight hours, Seattle has heavy cloud cover, meaning one of the three observation categories BKN (broken), OVC (overcast) or VV (vertical visibility obscured), described here as no visible blue sky.
Completely clear skies (CLR) occur only 2% of the time (hourly values range from 1.67% to 2.59%).

09:00 is the cloudiest hour; clouds break up fastest around 14:00
Tabulating each rainy-season hour separately produces a clear curve:
- At 09:00, the cloudiest time of day,
BKN+OVC+VVtotals 85.6% (85.58% precisely), the daily maximum. - The hour around 14:00 shows the fastest cloud breakup:
OVCdrops by 3.51 percentage points in that hour, the largest rainy-season daytime decline. Meanwhile,BKNrises from 34.30% to 37.04%.
Consider those two numbers together:Afternoon clouds break into broken cloud cover, not clear skies. OVC Most of the decline in OVC shifts into BKN.
Now consider conditional probability. The rainy-season sample contains 3,091 days with complete observations. Of these, OVC or VV (fully overcast/obscured) conditions were present at 10:00 on 1,636 days. At 14:00 on those 1,636 days:
| Conditions at 14:00 | Share |
|---|---|
Still OVC or VV (fully overcast/obscured) | 66.6% |
Broken into BKN (broken cloud cover) | 28.3% |
Improved to SCT (scattered clouds) or better | 5.1% |
Improved to CLR or FEW (mostly clear) | 1.0% |
Basis: Iowa State ASOS / KSEA · 2005 through 2025 · November through March rainy season · 3,091 complete days · Reproducible using
analyze.pyandt4.py.
Two-thirds of fully overcast mornings remain overcast into the afternoon. Only 1% become mostly clear.
“Gray mornings, brighter afternoons” is real, but the difference is only three percentage points
The full conclusion first, to avoid misunderstanding: the impression is real. During the rainy season, however, the difference is only 3 percentage points, too small to drive a home purchase. Summer is where the pattern becomes pronounced, at roughly five times the rainy-season magnitude.
On a Seattle winter morning, a home can feel so gray that the lights seem off; around two or three in the afternoon, lights suddenly seem unnecessary. That impression is real, but its magnitude is much smaller than most people assume.
- During the rainy season, the morning-to-afternoon difference in
BKN+OVC+VVis 4.27 percentage points. Excluding periods when solar elevation is below 5 degrees, when usable light is limited anyway, reduces the gap to 3.06 percentage points. - More importantly, rainy-season “mostly clear” conditions (
CLRplusFEW, combining completely clear skies with a few clouds) occur in the morning at 8.52% and in the afternoon at 7.96%, a decline of 0.56 percentage points in the afternoon.
⚠ Do not confuse this with the earlier 2%:That 2% is
CLRalone (completely clear skies); the 8.5% here combinesCLRandFEW. These are different definitions, not contradictory data.
What improves in the afternoon is therefore the density of cloud cover, rather than whether the sun emerges. Thinner clouds make ambient daylight much brighter, producing the perceived improvement.
Another overlooked factor is visibility during the rainy season: it is lowest at 08:00 (8.30 statute miles), highest at 17:00 (9.23 statute miles), a daily range of 0.93 miles, or about 11%. Some of the morning's gray, enclosed feeling comes from near-ground fog and low cloud.
⚠ One more clarification is needed:The cloudy-morning, clearing-afternoon pattern exists in the rainy season, but summer is its strongest setting. From June through August, OVC falls from 28.17% during 09:00 to 13:00 to 13.12% during 14:00 to 18:00, a 15.05-percentage-point decline. BKN+OVC+VV drops from 59.62% to 47.77%. Locals call this June gloom.The same pattern is roughly five times as strong in summer as in the rainy season. The rainy season's 3.06-percentage-point difference is real, just much smaller. A December afternoon's apparent brightening is far less pronounced than July's.
Two other measures: percentage of possible sunshine and clear days
Cloud observations describe whether clouds are present. Two independent datasets address usable direct sunlight.
The Western Regional Climate Center reports measured percentage of possible sunshine (sunshine-recorder basis, Sea-Tac):
| Month | Measured percentage of possible sunshine |
|---|---|
| November | 28% |
| December | 23% |
| January | 28% |
| February | 40% |
| March | 50% |
| Annual | 47% |
NOAA / NCEI's Comparative Climatic Data uses day counts: station 24233 Sea-Tac, 51 years of records through 2023, reports annually 58 clear days, 82 partly cloudy days and 226 cloudy days. December alone has 2 clear days and 25 cloudy days. Across December and January's 62 days, only 5 days are clear.
⚠ In this table, the monthly figures do not add up to its own annual row because of NOAA's rounding. This article therefore does not derive annual totals by summing monthly figures. The previous paragraph's combined 5 days for December and January simply compares two adjacent monthly values and does not use the annual row.
⚠ Another frequently cited set of possible-sunshine percentages, December 20%, January 23%, July 64%, annual 45%, also comes from NOAA / NCEI, but Seattle's record covers March 1965 through December 1983, after which measurement stopped. Any citation must include that period; these figures must not be presented as current climate normals.
4. Seattle's solar path: azimuth and elevation at latitude 47.6 degrees north
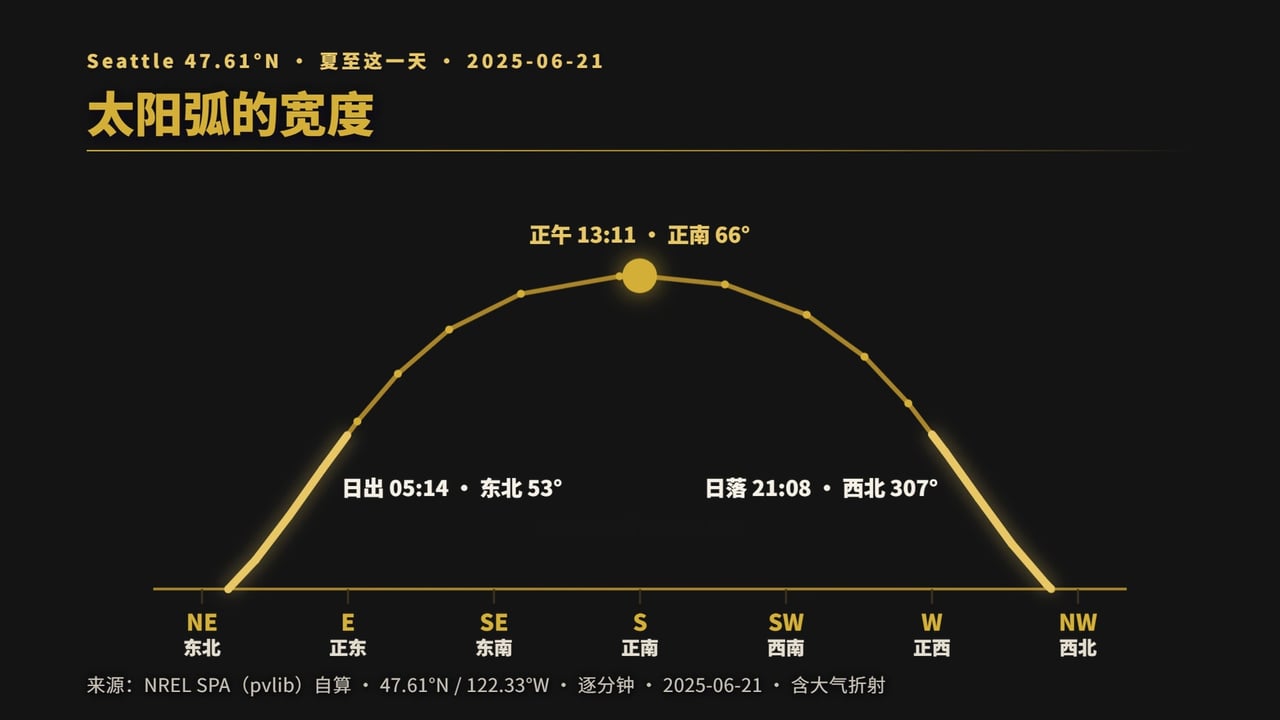
At Seattle's latitude of 47.6 degrees north, the sun does not spend most of its time due south, as many assume. Minute-by-minute calculations using pvlib's NREL SPA algorithm at 47.61 N / 122.33 W show:On the summer solstice, the sun spends 7 hours 01 minute in the northern half of the compass, at azimuth below 90 degrees or above 270 degrees, representing 44.1% of daylight. Its reported sunrise direction is 61.5 degrees, east-northeast, and sunset direction is 305 degrees, northwest toward north. Solar-noon elevation is 65.8 degrees at the summer solstice but only 19.0 degrees at the winter solstice, a 46.8-degree difference on the same wall. Lower angles also mean longer shadows: the winter-solstice noon shadow is 6.5 times the summer-solstice shadow.Clouds determine how much light is available. The solar path determines its direction.
Seattle is at 47.6 degrees north. This project consistently uses coordinates 47.61 N / 122.33 W.
The sun spends much less time due south than you might think
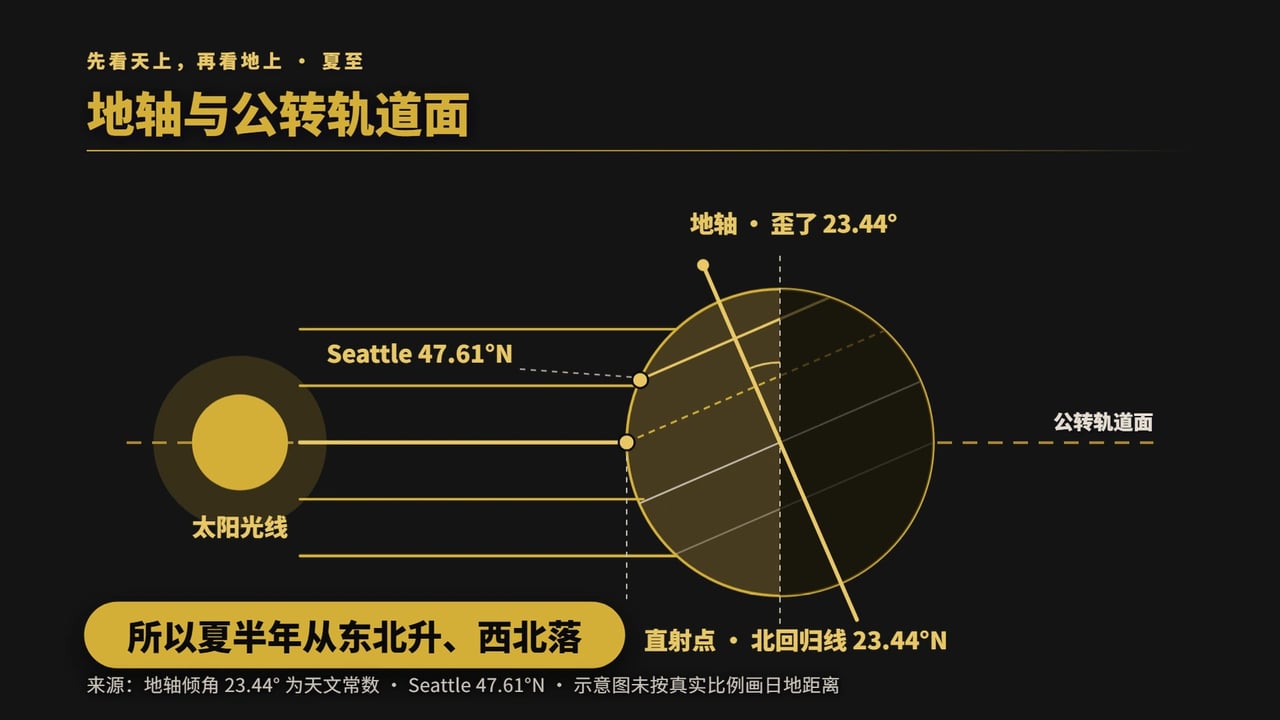
The Tropic of Cancer is at 23.44 degrees, the northernmost latitude reached by the overhead sun at the summer solstice. Many infer that Seattle, so far north of that latitude, should have the sun due south most of the time.
The reality is different. On the summer solstice:
| Local time | Solar azimuth (degrees) | Solar elevation (degrees) |
|---|---|---|
| 06:00 | 61.5 | 6.1 |
| 09:00 | 92.9 | 35.2 |
| 12:00 | 143.3 | 62.0 |
| 13:00 | 173.7 | 65.7 |
| 15:00 | 231.4 | 57.6 |
| 18:00 | 274.0 | 28.9 |
| 21:00 | 305.3 | 1.0 |
Basis: Minute-by-minute pvlib NREL SPA calculations, coordinates 47.61 N / 122.33 W, date 2025-06-21. Azimuth is 0 degrees north, 90 east, 180 south and 270 west. Elevation measures the sun's height above the horizon: 0 degrees at the horizon, 90 directly overhead. Reading the azimuth column as directions: 61.5 is east-northeast; 92.9 just past east; 143.3 southeast toward south; 173.7 almost south; 231.4 southwest toward west; 274.0 just past west; and 305.3 northwest toward north.
⚠ The 65.7 degrees shown at 13:00 is an on-the-hour sample. True solar noon occurs around 13:05 that day, reaching 65.8 degrees, the daily maximum of 65.8 used elsewhere in this article. The hourly table misses that peak; the values are consistent.
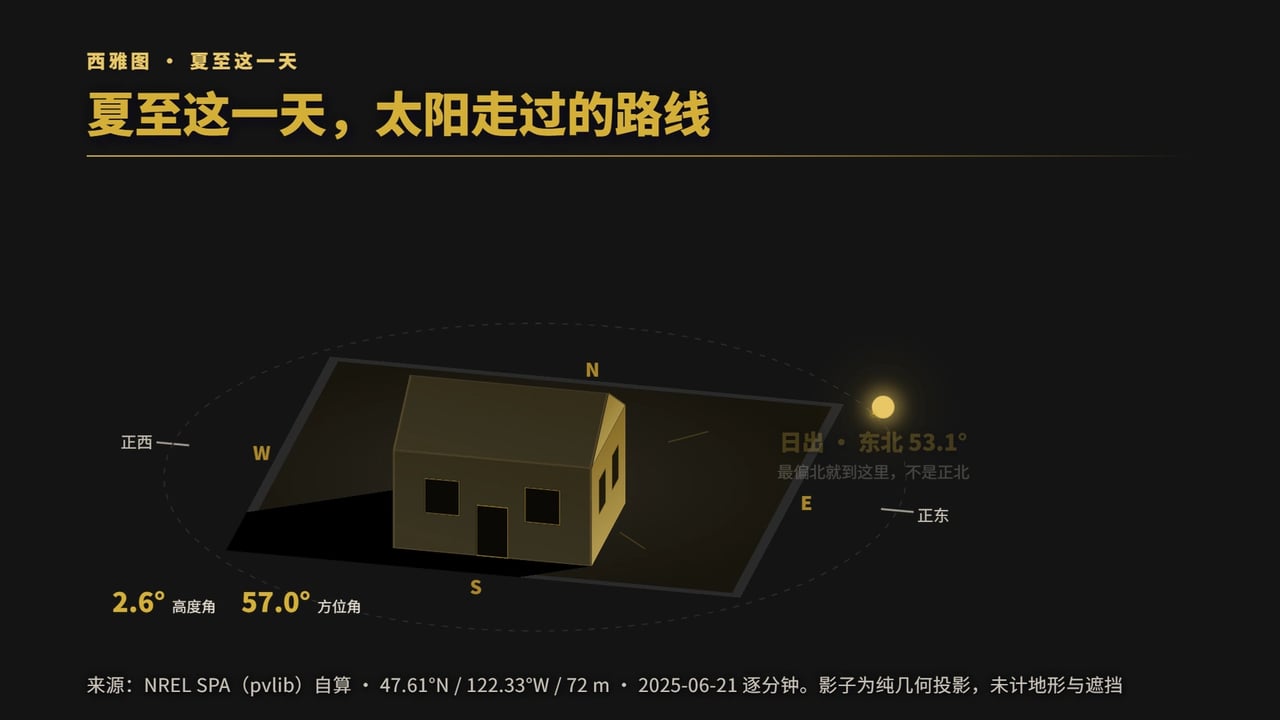
Look at the last row:At summer-solstice sunset, the sun is at azimuth 305 degrees, northwest toward north. The first row reports sunrise at 61.5 degrees, east-northeast.
Summer-solstice solar-noon elevation is 65.8 degrees. At winter-solstice noon it is only 19.0 degrees (18.96 precisely), falling by 3 p.m. to 9.13 degrees. At that point the sun's azimuth is 219.3 degrees, southwest rather than west. On the same wall, the winter-to-summer solar-noon elevation difference is 46.8 degrees.
Sunrise azimuth varies by approximately 72 degrees over the year, from 125.4 at the winter solstice to 53.2 at the summer solstice.
At the summer solstice, the sun spends 7 hours on the northern side of your home
Counting summer-solstice azimuths minute by minute, the sun spends 421 minutes, or 7 hours 01 minute below 90 degrees (north of east) or above 270 degrees (north of west). Total daylight is 955 minutes (15 hours 55 minutes), so those 7 hours represent 44.1%.
For almost half of a summer-solstice day, the sun is northeast or northwest of your home, rather than south.
Winter-solstice daylight is only 8 hours 22 minutes; summer-solstice daylight is approximately 1.9 times as long.
⚠ This article consistently uses pvlib SPA daylight durations: 15 hours 55 minutes at the summer solstice and 8 hours 22 minutes at the winter solstice. Other organizations treat atmospheric refraction and the solar disk's radius differently, yielding slightly different durations. Mixing definitions makes percentages inconsistent.
A lower sun also means longer shadows
This principle is used immediately below for tree shading, and again in Section 7 for indoor penetration depth. First, the numbers. An object's shadow length is a multiple of its height, determined only by solar elevation:
Basis: This project's calculations (Grade B), using pure geometry: shadow length = height ÷ tan(solar elevation), with pvlib SPA solar elevations at 47.61 N / 122.33 W. ⚠ All shadow lengths and shading radii below assume level ground and no other obstructions. They are upper limits. Slopes, neighboring buildings and additional trees change the actual shaded area.
| Time | Shadow-to-height ratio |
|---|---|
| Winter-solstice noon | 2.911 times |
| Equinox noon | 1.095 times |
| Summer-solstice noon | 0.449 times |
The winter-solstice shadow is 6.5 times the summer-solstice shadow. A 20-foot-tall house casts a northward shadow at winter-solstice noon measuring 58.2 feet; a 25-foot house casts 72.8 feet.
A 60-foot tree has a winter-solstice noon shading radius of 175 feet, compared with only 27 feet at summer-solstice noon. At 3 p.m. on the winter solstice, with the sun only 9 degrees high, the radius stretches to 373 feet.
This is the physical reason an August viewing cannot reveal how dark a home may be in winter.
⚠ Two common large Seattle yard trees are evergreen conifers that retain their foliage through winter:Douglas fir typically reaches about 80 feet in residential yards, producing a winter-solstice shading radius of 233 feet versus 36 feet in summer; Western red cedar reaches about 80 to 90 feet. They continue growing: at age 30, Douglas fir's annual height growth is approximately 24 inches. Dominant Western red cedar trees in 40- to 60-year-old pure stands in western WA average 1.64 feet of annual height growth.The obstruction angle you measure today will only be greater in ten years.
5. Eight orientations: annual totals and evening sunlight produce very different rankings
Rank the same eight directions by total annual sunlight and then by evening sunlight, and the results look almost unrelated.South leads annually; west leads in the evening. Only southwest ranks near the top in both. The following tables provide the complete rankings, with definitions and sources.Table A · Annual sunlight for eight orientations (South = 100)
Basis for all eight rows: PVGIS v5.3 · PVGIS-ERA5 reanalysis · 19 years, 2005 through 2023 · Vertical wall (
angle=90) · Terrain effects disabled.
| Orientation | Annual sunlight index (South = 100) |
|---|---|
| South S | 100 |
| Southwest SW | 95.6 |
| Southeast SE | 93.2 |
| West W | 74.5 |
| East E | 70.8 |
| Northwest NW | 42.9 |
| Northeast NE | 40.9 |
| North N | 24.2 |
Table B · Evening sunlight for eight orientations (West = 100)
Basis for all eight rows: Same source as Table A · April through September · Sum of local hours 17, 18 and 19.
⚠ In mid-September, only about 18 minutes of the 19:00 hour occur before sunset, which is as early as 19:18. Actual irradiance is included without adjustment. Aggregating six months leaves the ranking unaffected.
⚠ The north-facing result was independently recalculated minute by minute using pvlib; see the “North” subsection below.
⚠ All indices in the table are rounded. Do not divide displayed rows to infer percentage differences. For example, north's 17 and south's 15 are actually 16.7 and 15.3 before rounding, with a ratio of 1.088 (about 9%). Dividing the rounded values yields 13%, an artificial difference caused by rounding.
| Orientation | Evening sunlight index (West = 100) |
|---|---|
| West W | 100 |
| Northwest NW | 76 |
| Southwest SW | 72 |
| North N | 17 |
| South S | 15 |
| Southeast SE | 7 |
| East E | 7 |
| Northeast NE | 7 |
🔴 Read Table B's north and south rows together with this paragraph. Quoting them alone reverses the intended conclusion. North's 17 exceeding south's 15 is a limited phenomenon confined to these three evening hours from April through September. Summer sunsets shift northwest toward north, to 305 degrees at the solstice, allowing oblique sunset light to strike north walls.It provides no basis for saying north is better than south. In the same dataset, north's annual total is 24.2, lowest of the eight directions, while south's is 100, highest. North has about 181 days annually with no direct sunlight; south does not.Read Table B together with Table A. Table B alone leads to a mistaken conclusion.
🔴 Both tables require this qualification: These are upper limits for what a site can receive in that direction. PVGIS's horizon accounts only for terrain elevation, not trees, neighboring houses or eaves. Actual sunlight equals this upper limit multiplied by a shading discount, which often outweighs the difference between orientations.
⚠ These calculations also use downtown Seattle coordinates with the terrain horizon disabled. Enabling it raises the eastern and southeastern horizon by 9.9 to 10.7 degrees because of Capitol Hill, an effect of terrain rather than orientation itself. This article therefore consistently uses terrain-disabled results.

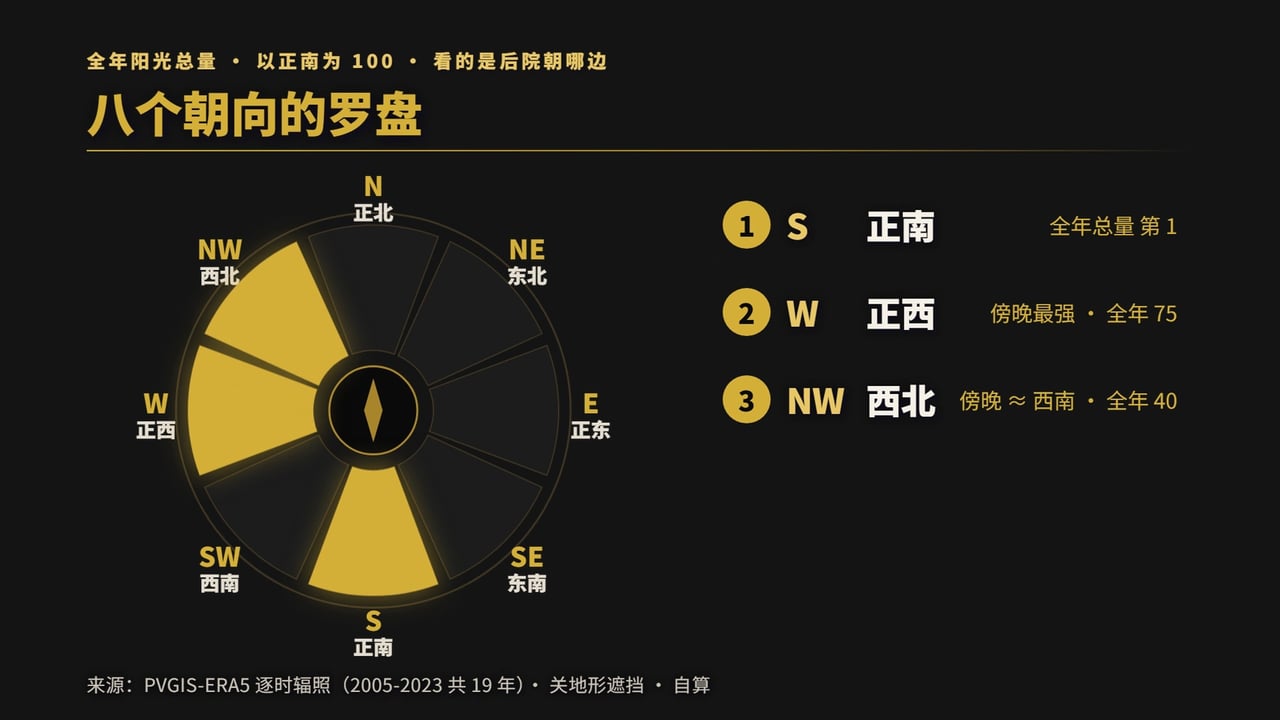
South: Highest annually, but its advantage comes when you may be away
For annual totals, south unequivocally ranks first among all eight directions.
But consider the timing:
- At the summer solstice, the sun spends within 30 degrees on either side of due south, a total 60-degree sector, only 1 hour 53 minutes, or 11.8% of daylight. Those fewer than two hours fall at midday, when most people are working.
- From April through September, sunlight reaching the south-facing wall after 5 p.m. accounts for only 6.1% of that wall's own six-month total.
- What about winter? With the low winter sun, 51.0% of daylight does fall within that 60-degree southern sector: 4.27 hours out of 8.37 daylight hours at the winter solstice.
But bring back the cloud figures from Section 3: Winter mornings are the cloudiest time of day, with 09:00 BKN+OVC+VV at the daily peak of 85.6%. Most of that 51% falls between morning and noon.
South gains time in winter without necessarily gaining light.
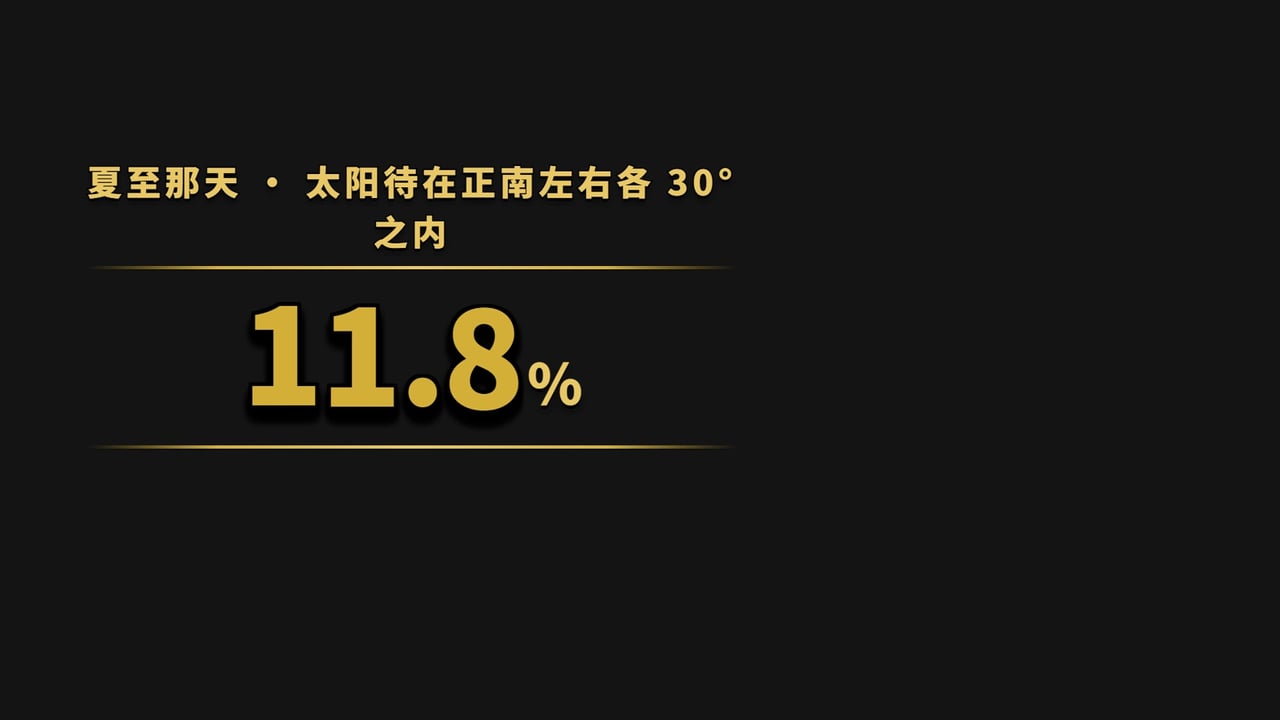

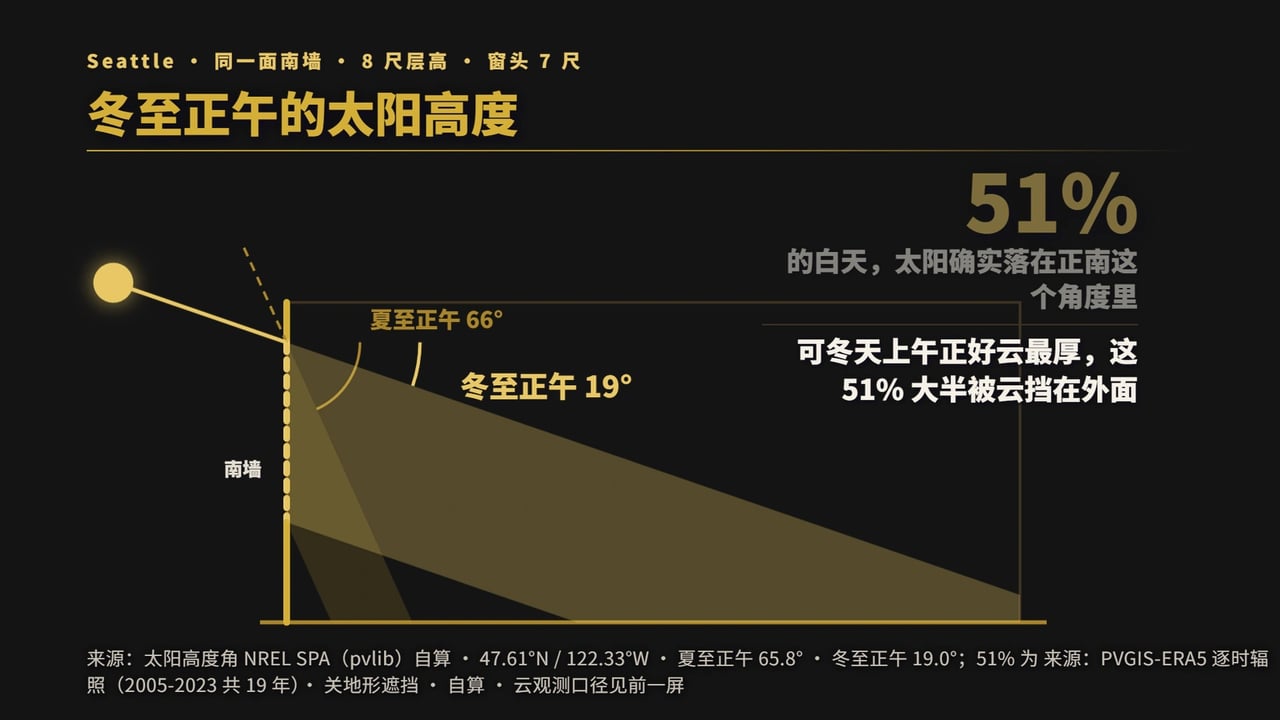
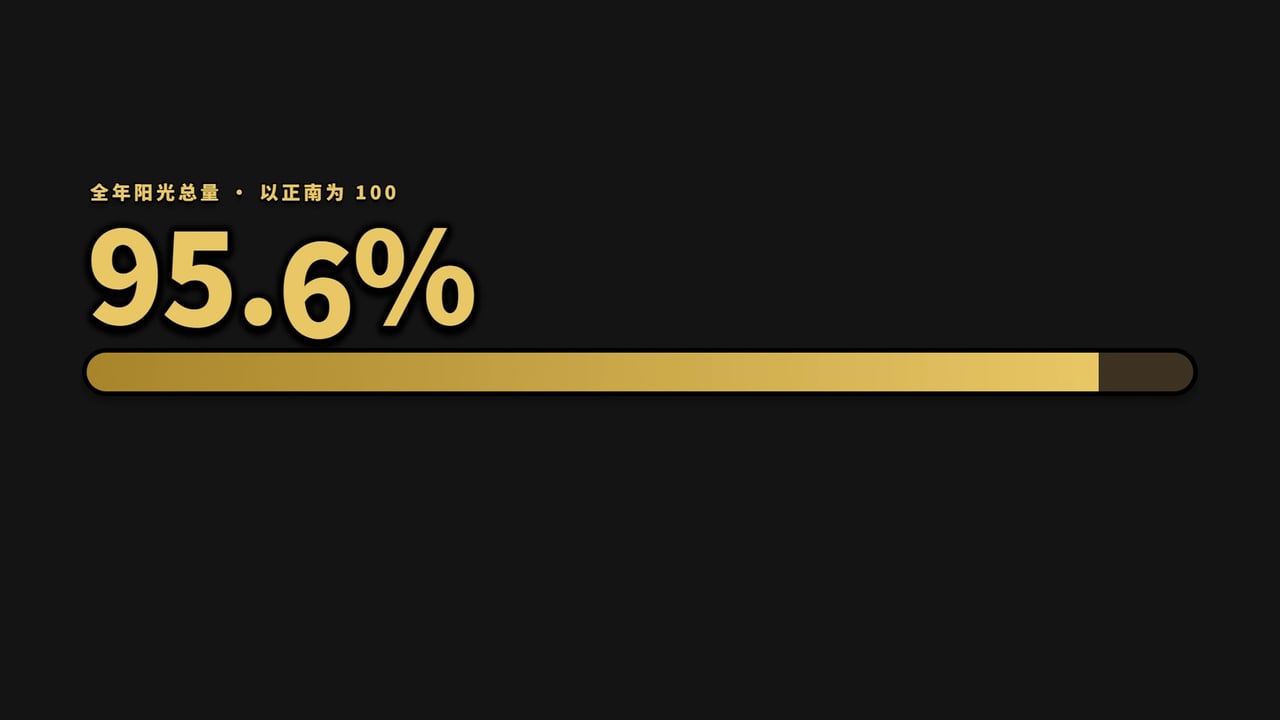
Southwest: Only 4.4 points behind annually, with 4.7 times south's evening sunlight
Southwest receives 95.6% of south's annual total, a gap below 5 percentage points.
During the three hours starting at 5 p.m., April through September (local hours 17, 18 and 19), southwest receives 4.7 times south's sunlight, almost 5 times as much.
A gap of 5 percentage points on one measure versus a factor of 4.7 on the other makes the choice straightforward.
West: First in the evening, at the cost of an annual total around three-quarters of south's
In those evening hours, west is strongest of all eight directions, ahead even of southwest: west 100 versus southwest 72.
The trade-off is an annual total of 74.5% of south's.
West places all its bets on the latter part of the day.

Northwest: Second in the evening, but shaded for much of the year
One point needs precision:Northwest ranks second for evening sunlight; it does not tie southwest. Northwest's evening index is 76 versus southwest's 72. Northwest receives 5.8% more than southwest, with that 5.8% calculated from unrounded wall irradiance. Dividing the displayed 76 by 72 gives 5.6%; the 0.2-point difference reflects rounding, not conflicting results.
⚠ But this alone is no reason to recommend northwest. Its annual total is only 42.9% of south's, leaving the yard shaded for much of the year and increasing maintenance challenges for lawns, gardens and outdoor furniture.
Northwest is an orientation whose sunlight is concentrated in the evening.
The three eastern orientations: respectable annual totals, problematic timing
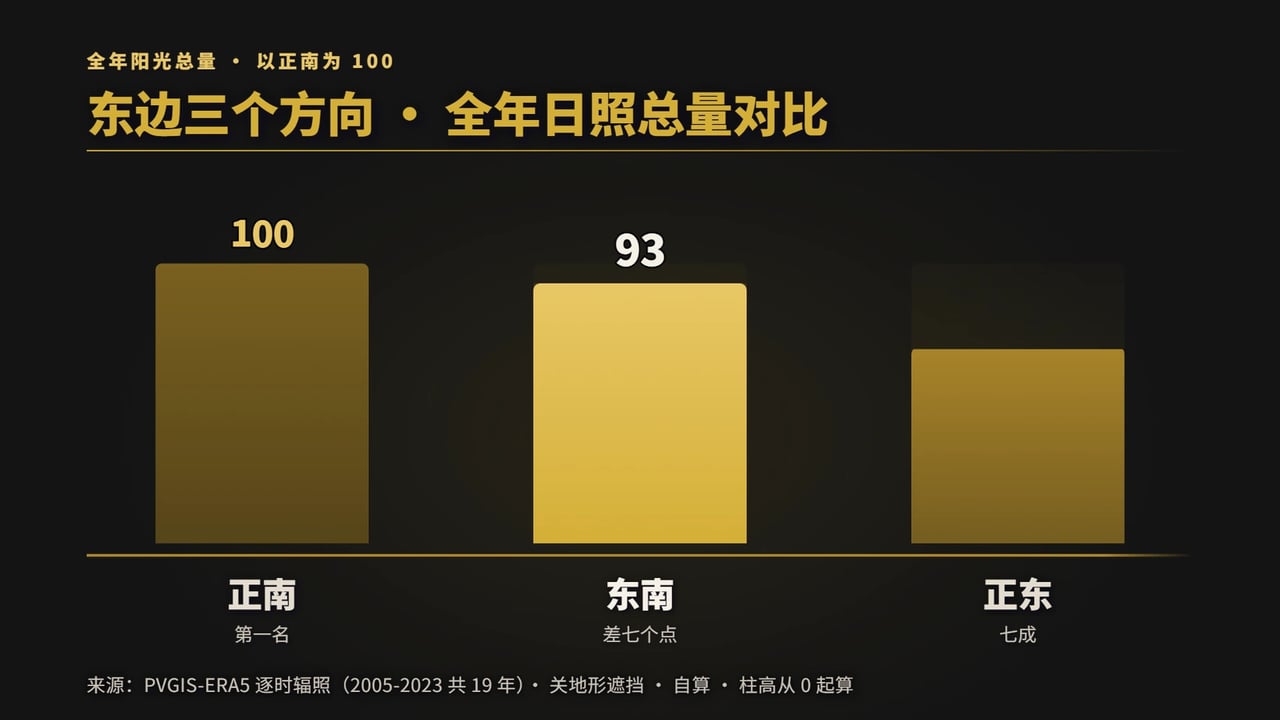
Southeast receives 93.2% of south's annual total; east receives 70.8%. Those are respectable annual figures.
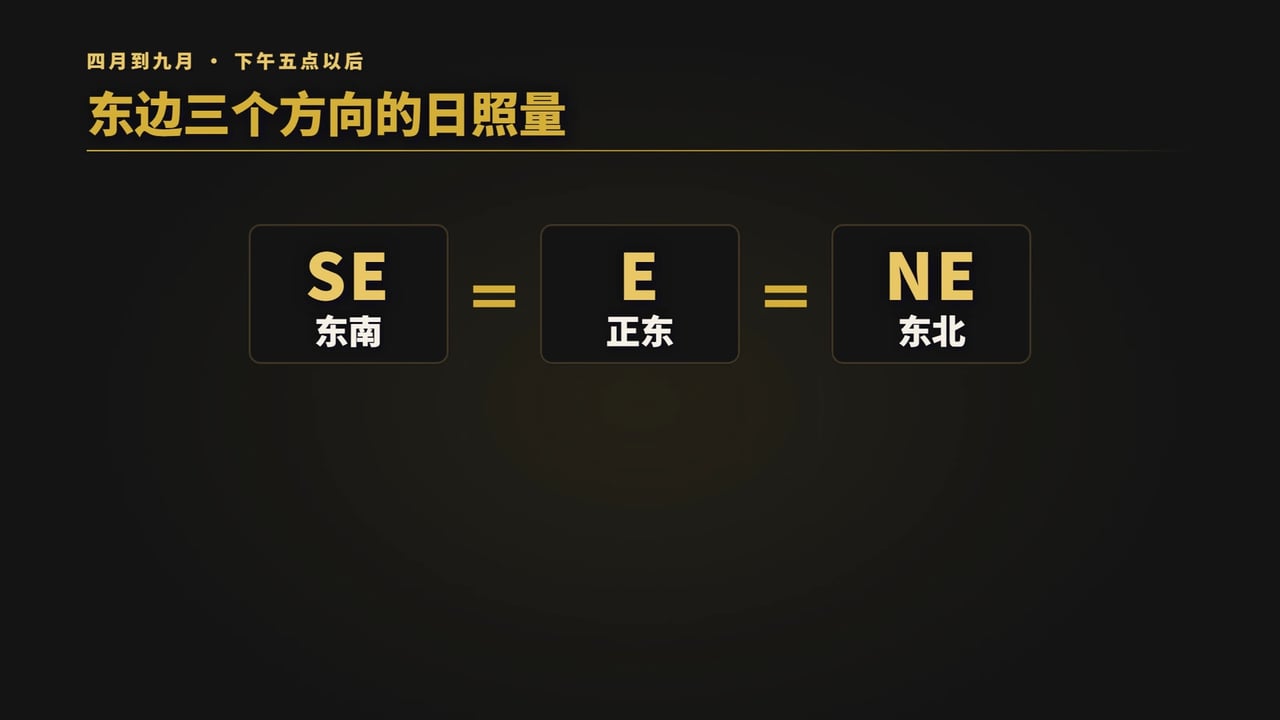
The problem is timing:After 5 p.m. from April through September, southeast, east and northeast receive exactly the same amount of sunlight. Each has an absolute evening total of 16.79 kWh/m², corresponding to index 7.
⚠ The exact match occurs because all three walls receive no direct sunlight during those three hours. Only diffuse sky light and ground reflection remain, and diffuse sky light is approximately symmetric across compass orientations.The equality results from zero direct sunlight, not from the three orientations being equivalent overall.
Why the identical result? The sun has moved behind these walls. They receive only diffuse sky light and ground reflection, with no direct sunlight, eliminating their differences during this window.
What about mornings? There is morning sun, and east can suit someone who enjoys early outdoor time. But consider two facts together:
- Morning's total is already lower than evening's. A separate calculation using Table B's benchmark, April through September and local hours 06, 07 and 08, puts east-facing morning exposure at about 82 when west-facing evening exposure is 100. ⚠ This 82 comes from a separate time-window calculation; it is not a row in Table B. The low-angle morning sun also coincides with the cloudiest part of the day, peaking at 85.6% cloud cover at 09:00.
- For people following the predominant local schedule discussed here, only a minority spend 6 to 9 a.m. in the yard.
My short answer to whether an east-facing home is worth considering is:For evening direct sunlight alone, all three eastern directions give the same answer: none.
⚠ This applies only to evenings, not their overall assessment. Annual indices differ greatly: southeast 93.2, east 70.8 and northeast 40.9. In Section 8's five-tier ranking, they fall into Tier 3, Tier 4 and Tier 5 respectively, not the same tier.
⚠ Another common claim should be rejected:East and north are not approximately equivalent. Table A puts east at approximately 2.9 times north and southeast at approximately 3.8 times.
North: Lowest annually, yet slightly ahead of south in the evening
One row in Table B is easy to overlook:North's evening index is 17, slightly above south's 15.
This is not a data error. Recall the summer-solstice azimuth table in Section 4:At summer-solstice sunset, the sun is at azimuth 305 degrees, northwest toward north.During April through September evenings, solar azimuth moves between 245 and 307 degrees. Approximately two-thirds of those minutes fall past west, in the northern half of the compass. North walls receive direct sunlight then, while the sun has moved to the side or behind south walls.
We reran those six months minute by minute with pvlib's NREL SPA algorithm, at 47.61 N / 122.33 W, counting only minutes with the sun above the horizon. In the 17:00 to 20:00 window, north walls receive 18,298 direct-sun minutes versus 13,197 for south walls, about 40% more. Summing clear-sky direct irradiance projected onto the walls also puts north about 7% ahead, broadly consistent with PVGIS's 9%. Table B's displayed 17 and 15 are rounded; the underlying values are 16.7 and 15.3, with a ratio of 1.088.
⚠ However, this advantage comes almost entirely from May, June and July. In April, August and September evenings, south still receives more. North's 17 is built from three midsummer months of sunsets, not a condition that holds every day for six months.
Basis: Minute-by-minute pvlib NREL SPA, 47.61 N / 122.33 W, elevation 72 m, America/Los_Angeles local time, April through September 17:00 to 20:00, counting only minutes with solar elevation above 0; verification script
_verify_north.py. Again, these are upper limits, excluding trees, neighboring houses and eaves.
⚠ This row does not change north's overall position: its annual total is only 24.2% of south's, the lowest of all eight directions. From the autumnal equinox, around September 22, to the following vernal equinox, around March 20, approximately 181 days pass without a single minute of direct sunlight on the north wall.
For half the year, the north wall receives zero direct sunlight.
The practical backyard effect can be quantified. For a 20-foot wall, the number of days when ground at different distances north of it receives at least 4 hours of direct sunlight is:
| Distance from wall | Days per year reaching 4 hours of direct sun |
|---|---|
| 5 feet | 122 days(April 22 through August 21) |
| 10 feet | 141 days |
| 15 feet | 159 days |
| 25 feet | 199 days |
| 40 feet | 256 days |
Basis: This project's calculations, Grade B, using pure geometry on level ground, without trees and under clear skies, cross-checked against NOAA's solar calculator. Again, these are upper limits.
The stated lawn-survival threshold is 4 hours of direct sunlight daily, regardless of variety, while vigorous growth requires 8 hours (Oregon State University Extension, EM 9175, published December 2017, reviewed 2026).
Poor grass growth beside a north wall is not a mysterious consequence of direction. That strip reaches the survival threshold on only about one-third of the year's days.
Another less obvious factor is that sunlight and water arrive in different seasons. October through March, when the north wall has no direct sunlight, receives 75.4% of annual rainfall, 29.65 inches. May through August, the qualifying season for the strip 5 feet from the wall, receives only 12.5%, or 4.90 inches. The wettest month, November, receives 10.5 times the rainfall of the driest month, July. (NOAA / NCEI 1991 through 2020 thirty-year normals, Sea-Tac station.)
The darkest period is the wettest; the brightest period is the driest. Poor grass growth there reflects the combination.
6. Western heat gain can be managed; missing eastern evening sunlight cannot
The first half of this section deliberately makes western heat gain sound uncomfortable: the problem needs to be established before discussing solutions. The conclusion remains the heading's point. Many practical methods can shade western sun, while an east-facing yard without sun after five has no equivalent remedy.Ranking west and southwest highly inevitably raises the question: what about hot western sun?Western heat gain is real, and can be harder to tolerate in Seattle because only 53% of WA homes use air conditioning, the lowest share among the contiguous 48 states, versus 89% nationally (EIA RECS 2020 state data, final version March 2023). But the two problems differ fundamentally in difficulty. Umbrellas, awnings, gazebos, blackout curtains, low-SHGC glass and deciduous trees can block sun. Nothing can move the sun into an east-facing yard after five.
Whenever west and southwest come up, someone asks whether that means unbearable afternoon heat.
First, an honest answer:Western heat gain is real.
- In WA, 53% of homes have some form of air conditioning; central air conditioning accounts for 30% of all homes, not 30% of the 53%. The national air-conditioning share is 89%, WA has the lowest share among the contiguous 48 states (EIA RECS 2020 state data, final version March 2023). ⚠ This is a 2020 survey and excludes installations following the 2021 heat dome.
- Public Health Seattle & King County's extreme-heat page explicitly notes that many King County homes lack air conditioning and have south- and west-facing windows that intensify indoor heat during extreme events.
- During the June 2021 heat dome, Seattle reached 108 °F on June 28, 2021, exceeding its previous record by 5 °F. The WA Department of Health's final report counted 157 heat-related deaths statewide from June 26 through August 30, 2021, including 34 in King County.
⚠ In the video I said that, as blackout curtains and air conditioning become more widespread, people care less about western sun.That premise runs against the direction of the EIA data and is not retained here. Greater acceptance of western exposure is my personal field observation, Grade C, an experience-based judgment without supporting data, rather than a demonstrated consequence of rising adoption.
Why, then, do I still rank southwest and west highly? Because the problems have unequal difficulty:
Blocking sunlight and moving sunlight are not equally difficult.
Ready-made shading options include umbrellas, awnings above windows, gazebos, blackout curtains, Low-E glass and deciduous trees. But no method can move the sun to an east-facing yard after five.
Managing western sun: three approaches work differently on south and west walls
| Approach | South wall | West wall | Assessment |
|---|---|---|---|
| Add a horizontal overhang | Blocks 81% in summer and only 26% in winter; seasonal selectivity 3.1 times | Blocks 42% in summer and 31% in winter; selectivity only 1.4 times | An overhang is a south-wall solution, not a west-wall solution |
| Install low-SHGC glazing | Effective | More effective | Prioritize this for west walls |
| Deciduous trees / awnings / gazebos / blackout curtains | Effective | Effective | Lowest cost; start here |
↔ This table is wide. Swipe horizontally on a phone to see every column
(SHGC is the solar heat gain coefficient. A lower value means less solar heat passes through the same area of glass.)
Why an overhang cannot solve western heat gain: Energy-weighted average solar elevation is 52.0 degrees for south, but only 33.0 degrees for west and 34.2 degrees for east. Horizontal overhangs and low-angle sun are a poor combination.
Sources and calculations for the two sets of figures above:
- Eaves and overhangs work best facing south and poorly facing west. A 2-foot overhang above a 6-foot window shades 74% of a south window at summer-solstice noon, but only 11% at winter-solstice noon, the desired seasonal selectivity. The same overhang shades only 27% of a west window at 17:00 in July and only 14% of an east window at 08:00 in July. (This project's calculations, Grade B, profile-angle geometry, Seattle 47.6 N.)
- The table's 81% / 26% / 42% / 31% figures use hourly calculations for an overhang with projection factor PF 0.50. (This project's calculations, Grade B, based on NREL NSRDB TMY hourly direct irradiance. PF equals overhang projection divided by window height; larger values mean more shade.)
- For a published sizing example, NREL's 1995 TP-463-7904 calculated Seattle overhang parameters relative to a glazing height of 1.000:Projection 0.749, underside 0.326 above the window head, and PF approximately 0.565. For a 5-foot-tall south window, that translates to a projection of 45 inches.
- Replacing glazing is better suited to west walls than adding overhangs. DOE Building America's 2012 guide modeled an unshaded Seattle house with 2,000 square feet of floor area and 300 square feet of glass. Cooling energy rose from 118 kWh at SHGC 0.23 to 281 kWh at SHGC 0.50, more than doubling. (⚠ These are modeled, not measured, values.)
- ⚠ A code detail: The 2021 IECC added a residential glazing requirement of SHGC ≤ 0.40 for Climate Zone 5 and Marine 4, but WA did not adopt it. WSEC-R's table has no SHGC column. In WA, therefore, the code does not require solar-control glazing for west windows; you must request it yourself.


7. How far sunlight enters: room depth, ceiling height and window-to-floor ratio
Orientation determines when sunlight reaches a wall. Room depth, ceiling height and windows determine how far it penetrates. For Seattle coordinates and a common configuration of 8-foot ceilings with a 7-foot window head:During April through September evenings at 17:00 to 19:00, direct sun penetrates only 1.9 feet through a south wall, compared with 11.4 feet through an otherwise identical southwest wall, a sixfold difference. That factor applies only to evening direct-sun penetration depth. ⛔ It does not mean a southwest-facing house is six times brighter than a south-facing one.Annual sunlight totals run the other way: south 100 versus southwest 95.6. South wins at midday; southwest wins in the evening. Raising ceilings from 8 to 10 feet adds about 1 foot of penetration for south and 3.2 feet for southwest. Better orientation gives ceiling height greater marginal benefit. Window-head height, not glass area, controls penetration depth.Everything so far concerns how much light the environment supplies. Next comes how the house receives that light.
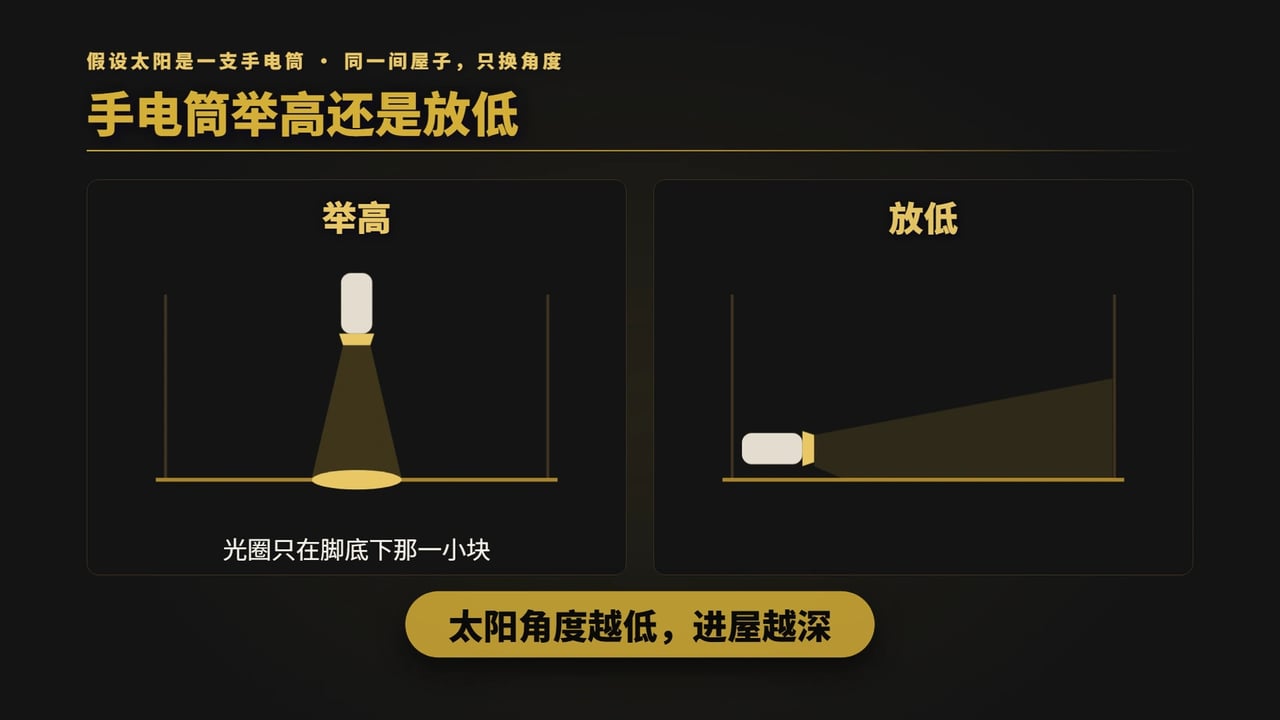
The connection is angle. Translating the repeated discussion of low solar angles into indoor terms:The lower the angle, the farther light travels into a room.
Imagine a flashlight held high and pointed down: its beam forms a small pool at your feet. Lower it toward horizontal and the beam reaches the other side of the room. Sunlight works the same way.
Calculating Seattle: two feet for south, eleven for southwest
The calculation assumes a common older-home configuration:8-foot ceilings, measured floor to ceiling, about 243.8 cm, with a window head approximately 7 feet above the floor. Direct-sun penetration equals window-head height multiplied by a coefficient determined by solar elevation.
| Scenario | Direct-sun penetration depth |
|---|---|
| South wall · Summer-solstice noon(Solar elevation 65.8 degrees) | 3.1 feet(About 91 cm) |
| South wall · April through September, 17:00 to 19:00(Median coefficient 0.27) | 1.9 feet(About two feet) |
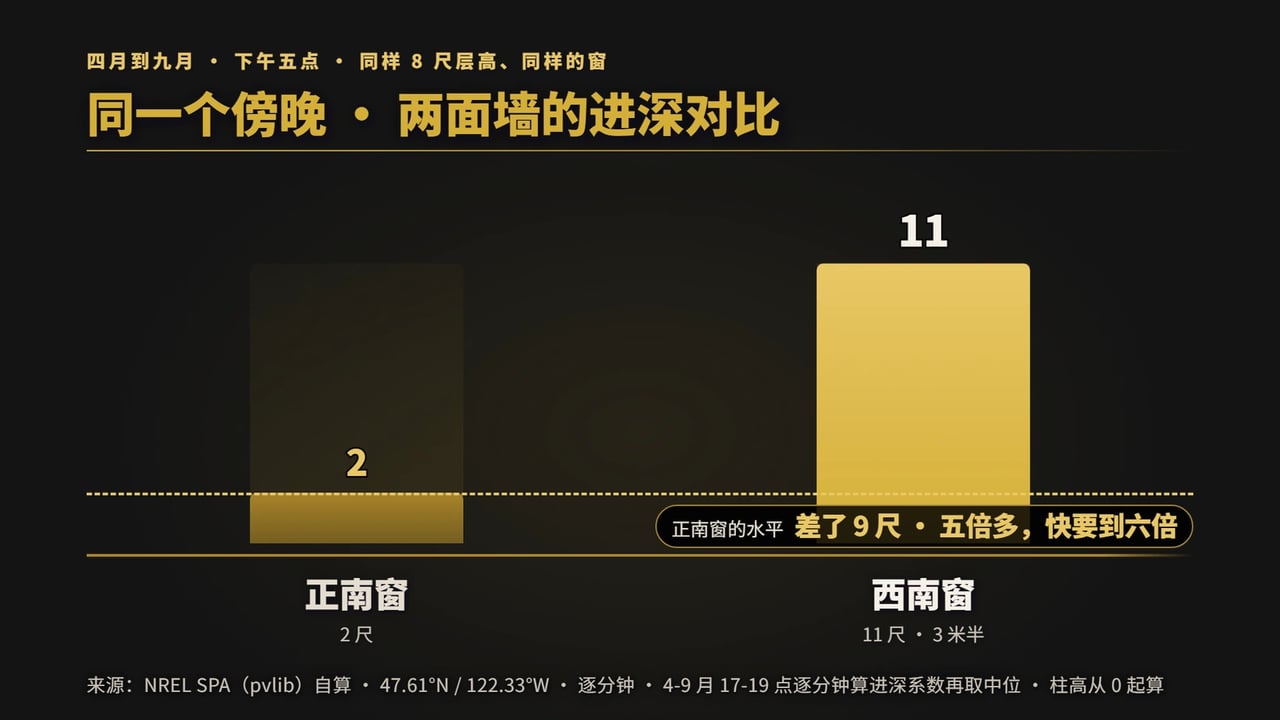
| Southwest wall · Same evening window, April through September(Median coefficient 1.62) | 11.4 feet(About 3.47 m) |
At summer-solstice noon, with the sun high overhead at 65.8 degrees, direct sun through the south wall penetrates only 3 feet, essentially a narrow strip beside the window. By five in the afternoon, south-facing penetration shrinks to 2 feet, nearly negligible.
With identical ceilings, windows and other conditions, simply facing the wall southwest allows penetration during the same period of 11 feet.
Two feet versus eleven feet: a sixfold difference.
⚠ That factor has strict conditions and must not be presented as a southwest house being six times brighter. It compares only the horizontal penetration depth of direct sunlight, only during April through September, local hours 17 through 19, and assumes identical ceiling heights, window-head heights and obstructions. For total annual sunlight, south is 100 and southwest 95.6, so south is higher. There is no contradiction: south wins at midday, southwest in the evening.
During the pandemic, several friends working from home and staying home on weekends reported the same experience: they had bought believing south was best and placed an office on that side, only to find the narrow midday strip of sun unhelpful and still need electric lights. (⚠ This is my field observation, Grade C, not a statistical conclusion.)
The effect is also more pronounced in older homes: lower ceilings generally mean lower windows, reducing penetration depth proportionately.

From 8-foot to 10-foot ceilings: about one extra foot for south, about three and a half for southwest
This is one of the article's most counterintuitive and easily reproducible results. Raise the ceiling from 8 to 10 feet and the window head from 7 to 9 feet, and penetration scales by the same coefficient:
| Orientation | 8-foot ceiling (7-foot window head) | 10-foot ceiling (9-foot window head) | Net gain |
|---|---|---|---|
| South (summer-solstice noon) | 3.1 feet | 4.04 feet | About 1 foot |
| Southwest (17:00 to 19:00) | 11.4 feet | 14.58 feet | About 3.2 feet |
↔ This table is wide. Swipe horizontally on a phone to see every column
Basis: Window-head height divided by tan(solar elevation), or multiplied by the median coefficient for that orientation and time window. Coefficients come from this project's eight-direction penetration script; changing one parameter reproduces the calculation.
The same two-foot ceiling increase adds only about one foot of penetration facing south, but more than three feet facing southwest. Better orientation increases the marginal benefit of ceiling height.
One related point:Window-head height, rather than glass area, determines daylight penetration depth. Reinhart's 2005 Radiance simulation study, presented at IBPSA Montreal, found that glazing below work-plane height does not contribute to daylight penetration. Floor-to-ceiling windows look attractive, but raising the window head is what helps depth.
The New Buildings Institute's Daylighting Pattern Guide and WBDG both include the same rule of thumb:Effective single-sided daylight penetration is approximately window-head height multiplied by a factor.
The factor is not fixed. It depends on three things:
| Consideration | Multiplier |
|---|---|
| Building type | Residential 2.5 times; office 1.5 times |
| Sky conditions | Overcast 2.5 times; clear sky 3 to 3.5 times |
| Shading blinds present? | With blinds, falls to 1 to 2 times |
Seattle homes and predominantly overcast conditions both point to 2.5 times. Two further limits: single-sided daylight penetration has an approximate absolute maximum of 25 feet, while the truly bright band near the window is only 10 to 15 feet. (For the residential 2.5 versus office 1.5 distinction, see Nik Ibrahim & Hayman 2005, citing Schiller 1992 and AIA 1982.)
⚠ Three cautions: ① This is a rule of thumb, not a law. Simulation studies have tested it and found it does not always hold; treat it as Grade B. ② Different organizations' factors of 2.5 and 2 use different denominators, one measured from the sill and another from the floor, potentially approaching a twofold difference for the same room. Do not mix them. ③ This article's two-foot versus eleven-foot calculation measures direct-sun penetration, a different quantity from the rule of thumb's daylight penetration. Do not substitute one for the other.

Windows: The Pacific Northwest's measured window-to-floor ratio is only 12%, versus a 20% daylighting recommendation
First distinguish two similar terms used in this section that mean very different things:
| Term | Calculation | Question answered | Where used here |
|---|---|---|---|
| Window-to-floor ratio | Window area ÷ room floor area | Is this room bright enough? | This section's measured 12% and recommended 20% |
| Window-to-wall ratio | Window area ÷ this exterior wall's area | How much of this wall is glazing? | WA energy code below and the simulation in Section 10 |
↔ This table is wide. Swipe horizontally on a phone to see every column
The denominators differ. The values cannot be compared directly or converted into one another. Identify the measure before interpreting any percentage.
The Northwest Energy Efficiency Alliance conducted two Residential Building Stock Assessments across Idaho, Montana, Oregon and Washington. The first measured 0.125, based on 1,387 households, Ecotope, September 2012. The second measured 0.116, based on 1,100 households, Cadmus, fieldwork in 2016 through 2017, published March 2019. Together they covered 2,487 households.
Both rounds measured window-to-floor ratios between 11.6% and 12.5%, approximately 12%.
⚠ The two rounds do not form a time series. Sampling frames, contractors and measurement methods changed, so they cannot establish that windows became less common.
Daylighting-design literature recommends a window-to-floor ratio of at least 20% for a genuinely bright room.
⚠ Several official model assumptions provide context, but distinguish their denominators first: DOE prototype homes assume 15%, and the WSEC reference home also uses 15%. Both are window-to-floor ratios, comparable with the 12% and 20% above. Building America's 18% is a window-to-wall ratio, expressed as window area = 0.18 × exterior wall area. Its denominator is the exterior wall rather than floor area, so it cannot be compared directly with the preceding figures. All four are assumptions, not measured values.
Measured 12% is a full 8 percentage points below the recommended 20%, only 60% of the recommended level. This is the measured average across the housing stock, not just older homes.At that baseline, any orientation can struggle to provide sufficient brightness.
⚠ A common misunderstanding needs clarification:WA's residential energy code has no window-to-wall-ratio cap. The term window-to-wall appears 0 times in the residential energy chapter. Its soft benchmark is 15% of conditioned floor area. Additional glazing counts toward energy use without increasing the target, so larger windows are allowed but require compensation elsewhere. The actual 30% hard cap, extendable to 40% through high performance or optimized daylighting, belongs to the commercial code. The two are often confused.
⚠ There was historically a hard cap:The 2006 Washington State energy code limited glazing in Climate Zone 1, including King County, to 10% of floor area. Twenty years later, the hard cap is gone and 15% serves as the reference-home baseline. Residential and commercial section numbers, and the individual limits for the three 2006 options, are documented in the GitHub repository.
Another easily misread dataset concerns windows. Calculations from RECS 2020 public microdata, restricted to single-family homes, 12,319 weighted observations, with field filters and definitions in the GitHub repository, show:Windows per thousand square feet fell from 9.49 in prewar homes to 6.5 to 6.7 in homes built after 2010, a decline of about 30%. Over the same comparison, floor area rose 43%, from 1,896 to 2,708 square feet, while the absolute number of windows remained between 13 and 17 over fifty years.
⚠ This table cannot establish that newer homes have less glazing. RECS records window counts, not a single square foot of area. Modern sliding doors, floor-to-ceiling windows and fixed picture windows are much larger than 1950s double-hung windows. These data support only the interpretation that newer homes have fewer, larger windows, while older homes have more, smaller ones.
Orientation, ceiling height and windows jointly determine daylight
Orientation controls when sunlight enters; windows and ceiling height control how much enters. All three matter.

8. Conclusion: I group the eight orientations into five tiers
Combining the light available outside with the home's ability to receive it produces this practical ranking:| Tier | Orientation | Reason |
|---|---|---|
| Tier 1 | Southwest SW | The all-rounder: 95.6% of south's annual total and 4.7 times south's sunlight during the three evening hours, 17 through 19, April through September. Strong on both measures |
| Tier 2 | West W | Strongest evening exposure among eight directions, at the cost of an annual total only 74.5% of south's |
| Tier 3 | South S · Southeast SE | Excellent annual indices of 100 and 93.2, but their advantage comes when you may be away. Easier lawn and yard upkeep is a benefit |
| Tier 4 | Northwest NW · East E | Northwest has good evening exposure, index 76, but only 42.9 annually. East's annual 70.8 is reasonable, but its evening index is only 7 |
| Tier 5 | North N · Northeast NE | Annual indices of 24.2 and 40.9, near the bottom across the two measures |
Basis: Annual figures use PVGIS v5.3, PVGIS-ERA5, 19 years from 2005 through 2023, vertical-wall irradiance with terrain effects disabled. Evening figures sum local hours 17, 18 and 19 from April through September. Both are upper limits, excluding trees, neighboring houses and eaves. The opening overview table gives both indices and a one-sentence assessment for each orientation.
This table ranks daylight, not the whole property. It answers only how much annual and evening light a wall can receive. It does not determine whether the house is good or whether you should buy it. Lifestyle fit, price, layout and design can each matter more than daylight.
Even for daylight alone, orientation sets only the upper limit. You cannot change that directional limit, but obstructions, window-to-wall ratio and room depth vary. Any one can outweigh the orientation difference. Section 10 develops that point. An east-facing home without large obstructing trees and with well-sized, well-positioned windows can receive more actual daylight than a southwest-facing home behind a row of evergreen conifers. Thoughtfully placed and sized windows can still create a bright home.
In other words, the ranking tells you whether daylight is one of a home's strengths. A house without that strength may suit you exceptionally well in other respects. If daylight matters most, inspect the three factors in Section 10, which you can see and ask about at a showing.
Section 6 addressed western heat gain for southwest and west: many methods can shade sunlight, but none can move it. Both parts belong in the same conclusion.

9. Frequently asked questions about Seattle home orientation
Is south or west better for a Seattle home?
It depends on when you are home. South ranks first for annual sunlight, with west at 74.5 when south is 100. But west leads after five in the evening, with south at only 15 when west is 100. Most people are home and use the yard in the evening, making west more practical under that schedule. To combine both advantages, choose southwest: 95.6% of south's annual total and 4.7 times its evening total. These are PVGIS v5.3 vertical-wall irradiance results for 19 years, 2005 through 2023, with terrain effects disabled, representing upper limits without trees or neighboring houses.
Which orientation should I choose when buying in Seattle?
Rank the backyard-facing wall in five tiers: first southwest; second west; third south and southeast; fourth northwest and east; fifth north and northeast. This means backyard orientation, not front-door orientation, because common Seattle plans place large windows in the rear Great Room. The ranking assumes all other conditions are equal. At a showing, obstructions, window-to-wall ratio and room depth can each erase much of the difference.
Is western sun a serious heat problem in Seattle?
Yes. Only 53% of WA homes use air conditioning, versus 89% nationally, the lowest share among the contiguous 48 states (EIA RECS 2020). Public Health Seattle & King County specifically notes that south- and west-facing windows increase indoor heat during extreme events. Seattle reached 108 °F on June 28, 2021. But western heat gain can be managed with awnings, gazebos, blackout curtains, low-SHGC glazing and deciduous trees. Missing sun after five in an east-facing yard cannot be remedied in the same way.
What is the drawback of an east-facing Seattle home?
Annual totals are respectable: southeast receives 93.2% of south's total and east 70.8%. Timing is the issue. After five from April through September, southeast, east and northeast receive exactly the same 16.79 kWh/m² because the sun has moved behind those walls. Only diffuse sky light and ground reflection remain, without direct sun. Morning exposure from 06:00 to 09:00 is itself lower than evening exposure, approximately 82% of west's evening total, and 09:00 is Seattle's cloudiest hour, at 85.6%. (Cloud observations are from Sea-Tac Airport, about 15 to 25 miles from the Eastside across Lake Washington.)
Does ceiling height strongly affect daylight in Seattle homes?
Yes, and its benefit grows with favorable orientation. At Seattle coordinates, raising ceilings from 8 to 10 feet and window heads from 7 to 9 feet increases south-wall direct-sun penetration at summer-solstice noon from 3.1 to 4.04 feet, about 1 foot. Southwest evening penetration rises from 11.4 to 14.58 feet, about 3.2 feet. The same two-foot ceiling increase yields more than three times the benefit in one orientation. Also, window-head height, not glazing area, controls penetration. Glazing below work-plane height contributes no penetration depth.
Does orientation matter during Seattle's cloudy winter?
Yes. During truly overcast hours, directional differences largely disappear, but during the remaining sunny hours, light on south walls remains primarily direct. Mathematically, the CIE standard overcast luminance formula contains elevation but no azimuth. Seattle is not 100% overcast: rainy-season daytime heavy cloud cover is 79% to 86%, and measured annual possible sunshine is 47% (Western Regional Climate Center, Sea-Tac). Overcast skies are not uniform either: the zenith is 3 times brighter than the horizon. (Cloud observations and sunshine percentages both come from Sea-Tac Airport, 15 to 25 miles from the Eastside across Lake Washington. Eastside microclimates were not independently validated in this round.)
Is a north-facing Seattle home necessarily a poor choice?
Separate daylight from the purchase decision. North has the lowest annual sunlight of all eight directions. Whether the house is worth buying depends on price, layout, location and personal fit. The daylight facts are: annual sunlight is only 24.2% of south's; the north wall receives no direct sunlight for about 181 days between the autumnal equinox around September 22 and the following vernal equinox around March 20; and the lawn strip 5 feet from the wall reaches the survival threshold on only 122 days annually.
Two qualifications apply, but neither changes those figures. First, we have encountered north-facing homes that were brighter than some south-facing homes because of terrain, ceilings, materials or even interior paint colors. This is personal observation, Grade C, not statistics. Second, north's evening index of 17 slightly exceeds south's 15 during three hours from April through September because summer-solstice sunset occurs at azimuth 305 degrees, in the northern half of the compass.That second point covers only three hours per day over half the year. It does not recover the missing 75.8% of annual sunlight.
The precise conclusion is that daylight is not a north-facing home's strength. If daylight is your top priority, approach that orientation carefully. If other features fit especially well, with large windows and unobstructed surroundings, it can still be a good choice.
Should orientation refer to the front door or backyard?
The backyard. Garages occupy much of the front in common Seattle floor plans and contribute no daylight to living spaces. The remaining foyer, office and formal dining room have windows but are used less. The open rear Great Room is both heavily used and extensively glazed. NAHB's 2019 survey found that among homes with a Great Room, 77.2% incorporated the kitchen and 61.4% the breakfast nook. The rear wall's orientation therefore most strongly shapes everyday experience.
Are south-facing Bellevue homes more expensive?
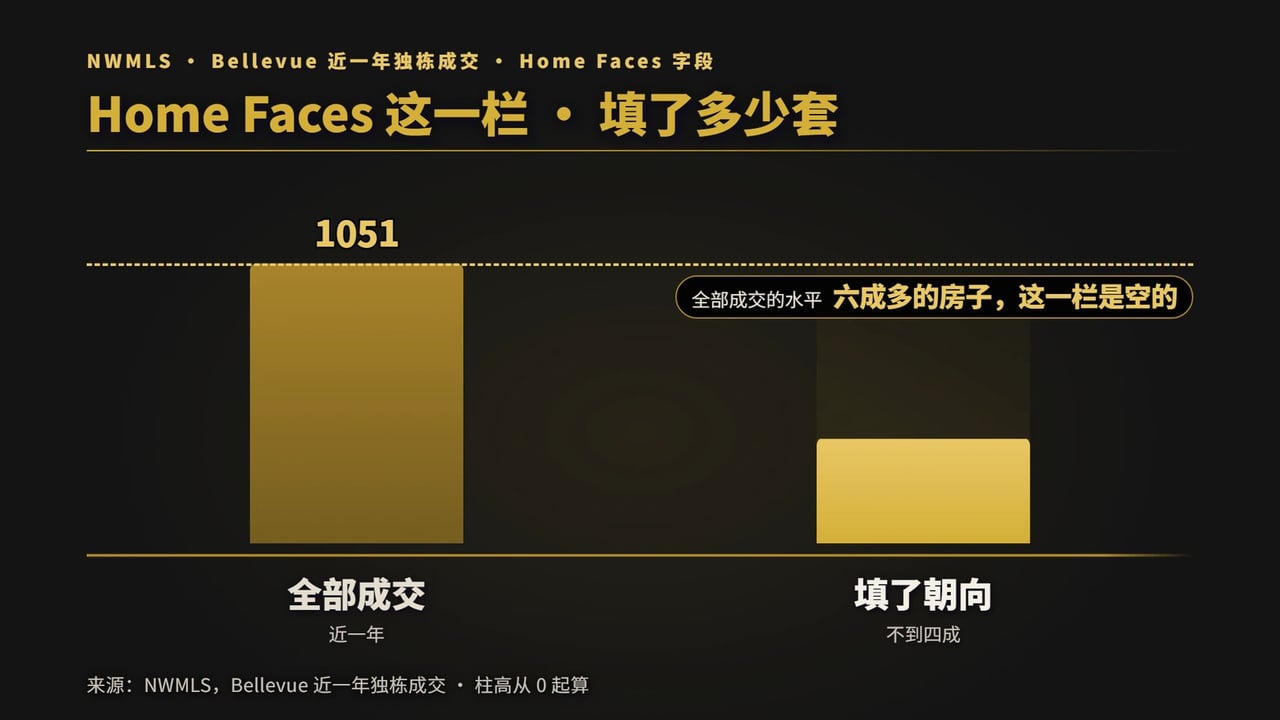
There is not enough evidence to establish that, and this article makes no pricing conclusion. NWMLS's optional Home Faces field was completed for only 396 of 1,051 Bellevue single-family sales, 37.7%, from 2025-08-01 to 2026-08-01. It also records front-door orientation, not backyard orientation. Agents choose whether to fill it in, creating selection bias, and observations are scattered across dozens of subdivisions. The sample is too small to support any current claim that south-facing homes command a particular percentage premium.
Can a lawn survive in a north-facing Seattle backyard?
It depends on distance from the wall. North of a 20-foot wall, the strip 5 feet away receives at least 4 hours of direct sun on only 122 days, April 22 through August 21. At 10 feet it is 141 days; at 15 feet, 159; at 25 feet, 199; and at 40 feet, 256. The stated lawn-survival threshold is 4 hours daily, with 8 for vigorous growth (Oregon State University Extension, EM 9175). In addition, October through March, with no direct sun on the north wall, receives 75.4% of annual rainfall. The qualifying May-through-August period receives only 12.5%.The darkest time is wettest and the brightest time driest. Their combination explains poor grass growth.
Is south best in Seattle, as it is commonly considered in China?
Not entirely, because “best” has a different definition. South does rank first for annual sunlight, consistent with the conventional preference in China. But its advantage is concentrated at midday: at the summer solstice, the sun spends only 1 hour 53 minutes within 30 degrees of south, 11.8% of daylight. After five from April through September, south receives only 6.1% of its own six-month total. At the winter solstice, 51.0% of daylight falls within that southern sector, but those hours overlap the cloudiest part of the day, with 09:00 heavy cloud cover at 85.6%.South gains time in winter without necessarily gaining light. At latitude 47.6 north, summer sunset occurs at azimuth 305 degrees, northwest toward north, and the sun spends 44.1% of daylight in the northern half of the compass. That differs greatly from the experience at most Chinese urban latitudes. Southwest is therefore more practical than south in Seattle under the schedule discussed here.
How many clear days does Seattle have annually?
NOAA / NCEI's Comparative Climatic Data, station 24233 Sea-Tac, using 51 years of records through 2023, lists 58 clear days, 82 partly cloudy days and 226 cloudy days annually. December has 2 clear days and 25 cloudy days; December and January together have only 5 clear days among 62. A separate measure, Western Regional Climate Center's measured possible sunshine at Sea-Tac, is 23% in December and 47% annually. ⚠ Another often-cited NOAA / NCEI series, December 20%, July 64%, annual 45%, covers Seattle only from March 1965 through December 1983, after which measurement stopped. Cite that record period rather than presenting current normals. ⚠ The day-count table's monthly values do not sum to its own annual row because of NOAA rounding. The adjacent monthly values above are compared directly, not used to derive an annual total.
Do the same conclusions apply to Bellevue, Kirkland and Redmond?
The orientation geometry is the same; the cloud conclusions may not be. Solar position and wall irradiance depend on latitude and atmospheric conditions. Bellevue, Kirkland and Redmond differ from Seattle by less than 0.2 degrees of latitude, so the eight-direction ranking applies across Greater Seattle Eastside. But the cloud observations come from Sea-Tac Airport, about 15 to 25 miles away across Lake Washington. The Puget Sound convergence zone can produce substantially different cloud conditions in north King County and south Snohomish County.The cloud-section findings therefore strictly apply only to the Sea-Tac area. Eastside microclimates were not validated in this round; that would require triangulation using Boeing Field, Paine Field and Renton. For community and market introductions to Bellevue, Kirkland and Redmond, see the Xceed Realty community pages.
10. Obstructions, window-to-wall ratio and room depth can each outweigh orientation differences
Section 8's five-tier ranking assumes equal conditions, which real homes never have.The precise statement is that orientation differences are bounded, while obstructions, window-to-wall ratio and room depth can each consume much of that potential advantage. ⛔ This does not mean that obstructions are categorically more important than orientation. That claim is unsupportable because orientation is a climate-level parameter, while obstructions, window-to-wall ratio and depth are property-level parameters. They cannot be placed in one universal ranking. Searches of NREL, NOAA / NCEI / NWS Seattle, WSU Extension, PNNL / DOE Building America and PVGIS found no such ranking.After ranking orientations, an apparently counterintuitive qualification is essential.
The ranking assumes all other conditions are equal. At a real property, they never are.
I have encountered individual cases, Grade C judgments based on personal observation without statistical support, in which terrain, surroundings, ceiling heights, materials or even interior paint made some north-facing homes brighter than some south-facing homes.These are cases, not a general rule. They show that other conditions can outweigh orientation, not that north is better than south.
The accurate statement is:Orientation differences are bounded, and obstructions, window-to-wall ratio and room depth can each consume much of that potential advantage.
⛔ This statement does not mean that obstructions are more important than orientation. That categorical claim does not hold. They cannot be ranked on the same universal scale because orientation is a climate-level parameter, while obstructions, window-to-wall ratio and depth are property-level parameters.
A useful finding for anyone researching this question:The literature provides no universal relative ranking of these four variables. We searched NREL, including NSRDB, PVWatts and the Solar Radiation Data Manual; NOAA / NCEI / NWS Seattle; WSU Extension; PNNL / DOE Building America; and PVGIS. None supplies that conclusion. The reason is not a lack of research, but that the ranking depends on the particular home's actual obstruction angles, glazing ratio and room depth, which are property-level rather than climate-level parameters. A universal answer does not exist.
Two published simulations indicate scale, but both require qualifications. Definitions of the three daylight metrics and the first study's three limitations appear in the GitHub repository:
- Raising window-to-wall ratio from 20% to 40% increased spatial daylight autonomy, sDA, by about 24 percentage points. Changing orientation at the same glazing ratio, best minus worst, produced only a 7- to 9-point difference. The former was 2.5 to 3.5 times the latter. A more extreme example: a north-facing room with 40% glazing ratio, sDA 49, outperformed a west-facing room with 20%, sDA 32. (Do et al., 2025, Scientific Reports 15:39507, 1,872 simulation cases.)
⚠ The simulation was conducted at low latitude, and the finding holds only over low-to-moderate glazing ratios. All three limitations are listed in the GitHub repository and must accompany these numbers when cited. - In Reinhart's 2006 study, reducing window width by 41% lowered DAcon by 32 percentage points. Changing orientation from south to east left Daylight Factor unchanged at 1.9% versus 1.9%, while lowering DAcon by 20 percentage points.(LEUKOS 3(1):1-25.)
⚠ Two limitations: ① The comparisons use different baselines, without a lightshelf in the first and with one in the second, so they cannot be compared strictly. ② The author's statement that Daylight Factor ignores orientation criticizes a limitation of the DF metric; it does not say orientation is unimportant.
Does Seattle's cloudiness make orientation irrelevant?
⛔ No. That inference is wrong and would be readily challenged by someone familiar with the subject.
The accurate statement is:During truly overcast hours, orientation differences largely disappear. During the remaining sunny hours, light reaching south walls is still primarily direct.
The mathematical reason is:The CIE standard overcast luminance distribution includes elevation but not azimuth. Under standard overcast conditions, orientation therefore has almost no effect on diffuse sky light. This follows from the daylighting method itself. The equation and source are in the GitHub repository.
⚠ Two qualifications matter:
- An overcast sky is not uniform. Under the same equation, the zenith is 3 times brighter than the horizon. Sky luminance is symmetric across compass directions, not uniform.
- Seattle is not 100% overcast. Rainy-season heavy daytime cloud cover occurs 79% to 86% of the time, while annual measured possible sunshine is 47%. Orientation still matters during the remaining hours.
One further disclosure is necessary:This project calculated the proportion of winter south-wall light that is direct using NREL NSRDB TMY hourly data, an isotropic sky model and ground albedo 0.20. The result supports the qualitative statement above. However, NREL has never published that decomposition. It is this project's Grade B calculation, and no ready-to-run reproduction script was available in this round. The article therefore gives the direction of the finding, not an exact percentage.
⚠ Two authoritative databases disagree on diffuse fractions:
| Period | NREL NSRDB TMY | PVGIS-ERA5 |
|---|---|---|
| December | 66% | 53% |
| January | 63% | 49% |
| July | 31% | 28% |
| Annual | 43% | 34% |
(An independent TMY3 calculation gives 65.0% for December, supporting the NSRDB column.)
This article does not decide which is correct. It makes two points: use the NSRDB column for building judgments, and preserve the direction of the relationship: more diffuse light means smaller orientation differences. Underestimating diffuse light in PVGIS implies overestimating direct light, so orientation differences in its Tables A and B may be amplified rather than reduced. This is one reason the eight-direction tables use normalized indices rather than absolute irradiance. The sole exception, the eastern directions' 16.79 kWh/m², appears because their exact equality is itself the finding. Indices would obscure the fact that they match without even a fractional difference.


11. Does orientation affect selling price?
This is one of the most frequent questions, and the honest answer is that the available data cannot establish it.NWMLS does have a field called Home Faces with eight values, East, North, Northeast, Northwest, South, Southeast, Southwest and West, matching the RESO Data Dictionary 1.7 DirectionFaces enumeration. But NWMLS Form 1 does not mark it as required.
I checked Matrix on August 24, 2026, using Bellevue, King County, Sub Type Residential, Status Sold, and closing dates from 2025-08-01 through 2026-08-01:
| Item | Count |
|---|---|
| All sales | 1,051 |
Home Faces populated | 396 (37.7%) |
| Of these, North | 77 |
| Of these, South | 66 |
Basis: Direct NWMLS Matrix search-counter readings, not estimates. ⚠ The 37.7% is a Bellevue completion rate, not an Eastside-wide rate.
The sample is too small for any pricing conclusion.
⛔ Three further problems go beyond sample size:
- The field records front-door orientation rather than backyard orientation. The Chinese-speaking buyers discussed here are primarily concerned with the backyard side, the opposite of what this field measures.
- Completing the field is self-selected, so the types of properties whose agents fill it in create selection bias.
- Whether the field flows through to downstream platforms such as Redfin or Zillow was not verified in this round.
Those 396 sales are also scattered across dozens of subdivisions. Matching north- and south-facing homes within the same neighborhood, floor plan and age range leaves only single-digit counts in each area.
The industry currently cannot calculate a reliable Seattle south-facing premium from NWMLS because a usable version of the needed dataset is not available there. This is not reluctance to answer; the data do not support anyone making that claim. When completion rates become sufficient, I will publish a full data report.
What can I say? Only this, with its evidence level clearly identified:
Xceed Realty founder Ryan Xu: Among the transactions I have handled, more than 500 over my career, when two homes have the same price, location and otherwise comparable conditions, the one with better interior daylight typically sells more smoothly.
⚠ This is a Grade C judgment based on my personal experience, not a data finding. It lacks statistical support and is not a pricing claim about any orientation.
⛔ This article makes no conclusions about sale prices, value retention or discounts by orientation, and no directional market forecasts.

12. Daylight is one of the few homebuying factors that can improve daily experience without a large added cost
A much larger homebuying budget often does not produce an equally large improvement in daily life. But daylight is one of the few areas where a relatively small cost can noticeably improve the living experience. Include it in your evaluation at every showing.Unlike location or floor area, daylight is not something you can obtain only by spending more. Within the same budget, choosing orientation and ceiling height thoughtfully and understanding obstructions can make a difference you feel every day.
If you are choosing between two homes, leave both addresses in the YouTube video's comments. I will take a look at their orientation and obstructions, free of charge. Leave other questions there too; I read them individually. If you prefer not to comment publicly, email ryan@xceedwa.com or call me at (425) 448-4960.
▶ Video version: https://www.youtube.com/watch?v=teF-Q4JQ-E8


End of the main article. The reference appendix below lists the sources behind the numbers.
Appendix · Methods and data sources
The source, year, sample size and reproducibility of the article's figures are listed below.Readers seeking only conclusions may skip to the three limitations after the table.
| Dataset | Organization · Year · Definition | Use in this article | Reproducible? |
|---|---|---|---|
| ASOS / METAR cloud observations | Iowa State University Environmental Mesonet, station KSEA (47.4444 N / 122.3139 W), 2005-01-01 through 2025-12-30; report_type=3, 183,690 rows, 183,674 usable observations | Rainy-season heavy cloud cover 79% to 86%, CLR 2%, 09:00 peak 85.6%, 14:00 OVC decline of 3.51 points, conditional probability 66.6%, morning/afternoon difference 3.06 to 4.27 points, precipitation-hour shares, visibility, June gloom | ✅ Retrieval and cleaning scripts available |
| PVGIS wall irradiance | European Commission PVGIS v5.3, PVGIS-ERA5 reanalysis, 19 years from 2005 through 2023; vertical walls (angle=90), eight orientations, terrain effects disabled | Table A annual indices, Table B evening indices, southwest 95.6%, west 74.5%, factor 4.7, eastern directions 16.79 kWh/m² | ✅ API URLs and parameters archived |
| Solar position | pvlib, NREL SPA algorithm, coordinates 47.61 N / 122.33 W, one-minute steps; summer solstice 2025-06-21, winter solstice 2025-12-21 | Summer-solstice noon 65.8 degrees, winter-solstice noon 19.0 degrees, 7 hours 01 minute = 44.1%, south ±30 degrees for 1 hour 53 minutes (11.8%) versus winter's 4.27 hours (51.0%), azimuth table, sunset times | ✅ |
| North-wall evening verification | Minute-by-minute pvlib NREL SPA, 47.61 N / 122.33 W, elevation 72 m, America/Los_Angeles; April through September 17:00 to 20:00, counting only minutes with elevation above 0 | North-wall direct sun 18,298 minutes versus south 13,197; clear-sky direct-energy ratio 1.07 (PVGIS including diffuse light 1.09); advantage concentrated in May through July | ✅ _verify_north.py |
| Indoor direct-sun penetration | This project's eight-direction penetration script; 7-foot window head with 8-foot ceilings, median coefficients for each orientation and time window | South 3.1 feet / 1.9 feet, southwest 11.4 feet; with 10-foot ceilings, 4.04 feet and 14.58 feet | ✅ Change the HEAD parameter |
| Percentage of possible sunshine | Western Regional Climate Center, Sea-Tac; sunshine-recorder measurements | December 23%, annual 47%, etc. | ✅ Calibration scripts available |
| Clear/cloudy day counts | NOAA / NCEI Comparative Climatic Data, station 24233, 51 years of records through 2023; day counts | Annual clear 58 / partly cloudy 82 / cloudy 226 days; December clear 2 / cloudy 25 | ❌ Published figures; can be cross-checked against ASOS |
| Possible-sunshine percentage | NOAA / NCEI, station 24233, record period 1965-03 through 1983-12; monthly percentages | December 20%, July 64%, annual 45% | ❌ ⚠ Measurement discontinued; cite the record period |
| Precipitation normals | NOAA / NCEI thirty-year normals, 1991 through 2020, Sea-Tac; monthly precipitation | October through March 75.4% annually (29.65 inches), May through August 12.5% (4.90 inches), November 10.5 times July | ✅ Aggregations Grade B; climate normals Grade A |
| Great Room composition | NAHB Spaces in New Homes, Paul Emrath, 2019-03-14, 153 single-family builders; Table 3 | Great Rooms with kitchens 77.2%, breakfast nooks 61.4%; kitchens still separate 70.6%; average area 800+ square feet | ❌ Published figures |
| Buyer preferences | NAHB What Home Buyers Really Want, Rose Quint, 2021-03; survey | 85% / 79% / patio 82% / rear porch 75% / deck 75% | ❌ |
| Measured window-to-floor ratio | NEEA Residential Building Stock Assessment, two rounds: Ecotope 2012-09 (n=1,387); Cadmus fieldwork 2016-17 / published 2019-03 (n=1,100); total 2,487 households across ID / MT / OR / WA; in-home window-to-floor measurements | 11.6% to 12.5%, approximately 12% | ❌ Published figures; ⚠ rounds do not form a time series |
| Daylighting recommendations | Daylighting-design literature 20% (window-to-floor); DOE prototype 15% (window-to-floor); Building America 18% (window-to-wall); WSEC reference home 15% (window-to-floor) | 8-percentage-point gap versus measured 12% | ❌ |
| Daylight penetration rule | New Buildings Institute Daylighting Pattern Guide and WBDG; residential/office distinction in Nik Ibrahim & Hayman 2005 citing Schiller 1992 and AIA 1982; rule of thumb | 2.5 times window-head height, 25-foot limit, 10- to 15-foot bright zone | ❌ ⚠ Grade B; note differing denominator definitions |
| Window-head height controls depth | Reinhart 2005, IBPSA Montreal, Radiance simulation | Glazing below the work plane contributes no daylight penetration | ❌ |
| Scale of glazing-ratio versus orientation effects | Do et al., 2025, Scientific Reports 15:39507, 1,872 simulation cases, Hanoi, latitude 21 degrees north; sDA | Glazing-ratio effect +24 points versus orientation 7 to 9 points | ✅ Subtraction from original Table 3, Grade B |
| Orientation under overcast skies | Reinhart 2006, LEUKOS 3(1):1-25; CIE standard overcast luminance formula, EnergyPlus Engineering Reference, originating in Moon & Spencer 1942; DF / DAcon | DF 1.9% versus 1.9%; zenith 3 times brighter than horizon | ❌ |
| Overhang geometry | This project's Grade B profile-angle calculations; NREL/TP-463-7904 (1995), Seattle station WBAN 24233; PF 0.50 hourly analysis based on NSRDB TMY | South summer 74%, winter 11%; PF 0.50 selectivity 3.1 times versus 1.4 times; NREL projection 0.749, PF 0.565, 45 inches | ✅ Equations provided; NREL figures are published |
| Air-conditioning adoption | EIA RECS 2020 state data, final version 2023-03; state level | WA 53%, central air 30% of all homes; national 89%; lowest among contiguous 48 states | ❌ |
| 2021 heat dome | NOAA / NCEI State Climate Extremes Committee memorandum; Washington State Department of Health final report; 2021-06-26 through 2021-08-30, statewide | Seattle 108 °F; statewide 157 deaths, King County 34 | ❌ ⚠ Multiple death-count definitions exist; this article uses only 157 with its observation window |
| Glazing SHGC and cooling energy | DOE Building America Measure Guideline (2012); modeled Seattle home, 2,000 square feet, 300 square feet of glass, unshaded | 118 kWh versus 281 kWh | ❌ ⚠ Modeled values |
| Energy codes | WAC 51-11R residential and WAC 51-11C commercial; WASHINGTON STATE ENERGY CODE 2006 EDITION Section 602.7.1 and TABLE 6-1; PNNL-31440; original documents | No residential window-to-wall cap, soft benchmark 15%; commercial 30% / 40%; 2006 Option I 10%; WA did not adopt 2021 IECC SHGC ≤ 0.40 | ❌ Original documents |
| Window-count trends | This project's Grade B calculations from RECS 2020 public microdata; filter TYPEHUQ = 2, 12,319 observations; WINDOWS uses group midpoints, NWEIGHT provides weights; windows per thousand square feet | Prewar 9.49 falling to 6.5 to 6.7; floor area up 43% | ✅ Method documented; ⚠ counts only, no window area |
| Lawn sunlight needs | Oregon State University Extension EM 9175, published 2017-12, reviewed 2026, and EC 1521; original text | Survival threshold 4 hours daily, vigorous growth 8 hours | ❌ |
| North-wall geometry | This project's Grade B calculation, cross-checked with NOAA solar calculator; level ground, no trees, clear skies | About 181 days without direct sun between equinoxes; north of a 20-foot wall, at 5 / 10 / 15 / 25 / 40 feet, qualifying days 122 / 141 / 159 / 199 / 256 | ✅ |
| Tree height and growth | City of Seattle Trees for Neighborhoods; USDA Forest Service Silvics and FEIS; NC State Extension; WSU EB0440; published values | Douglas fir 80 feet / annual growth 24 inches; Western red cedar 80 to 90 feet / annual average 1.64 feet | ❌ Shading radii can be recalculated |
| Time use | BLS ATUS 2025, released 2026-06-25; EPA Exposure Factors Handbook 2011 Table 16-15; Mitra et al. 2020 Energy and Buildings 210:109713; hours/day and minutes/day | Television 2.61 hours, cooking 0.71 hours; bedroom 588 minutes, living room 157 minutes; bedroom 54% to 63%, living room 19% to 27% | ❌ ⚠ EPA adult table has no living-room row; Mitra's rooms are inferred |
| MLS orientation field | Direct NWMLS Matrix readings, 2026-08-24; RESO Data Dictionary 1.7 DirectionFaces; Bellevue / King County / Residential / Sold / 2025-08-01 through 2026-08-01 | 1,051 sales, 396 populated (37.7%), North 77 / South 66 | ❌ Requires rerunning the same search |
| Community preference poll | 1p3a post 847249, 2022-02-05; 359 participants, up to 4 selections, 671 votes across eight options | Living room 197 votes (29.4%), master bedroom 170 (25.3%), backyard 106 (15.8%), front door 24 (3.6%) | ❌ Original-post counts; ⚠ vote shares, not participant shares |
↔ This table is wide. Swipe horizontally on a phone to see every column
Three limitations apply throughout. Include them when quoting any figures
- Cloud observations come from Sea-Tac Airport's weather station, about 15 to 25 miles from Bellevue, Kirkland and Redmond across Lake Washington. Findings strictly apply only to the Sea-Tac area.
- All geometry and irradiance figures are upper limits. They exclude trees, neighboring houses and eaves. A real home's result equals the upper limit multiplied by a shading discount.
- Grade B denotes this project's own calculations, with methods provided for reproduction. Grade C denotes experience-based judgments without supporting data. Every Grade C claim is explicitly identified.
Ryan Xu · Seattle Lao Xu | Xceed Realty Founder / Real Estate Broker
Washington State real estate license 20108301
520 112th Ave NE Ste 220, Bellevue, WA 98004
Phone (425) 448-4960 · Email ryan@xceedwa.com
YouTube @SeattleLaoXu · Profile Ryan Xu
Manuscript finalized: 2026-09-03 (original article v4)
Disclaimer: This content provides general information and is not financial, tax, legal or lending advice. Figures include their years and sources and may change over time. All geometry and irradiance figures are upper limits excluding trees, neighboring houses and eaves, not the actual sunlight conditions at any specific property. This article makes no conclusions or forecasts about sale prices, value retention or market direction by orientation. Assess individual properties through on-site inspection and professional advice.

Original publication
View the original websiteFROM READING TO EXPLORING
Explore these communities
Use these local guides to take the article’s questions into your own research. An article’s findings do not describe every home in these communities.
Compare neighborhoods on the map ↗CONTINUE THE CONVERSATION
Read next
Test the light at a specific home
Share the address, rooms you use most and your viewing schedule. We can help plan an on-site daylight check.