Published May 02, 2026 · Ryan Xu, w/ Xceed Realty · ~6 min read
Greater Seattle Eastside SFH Weekly Brief — May 02, 2026: Inventory at 4,088 (King), Absorption 1.00
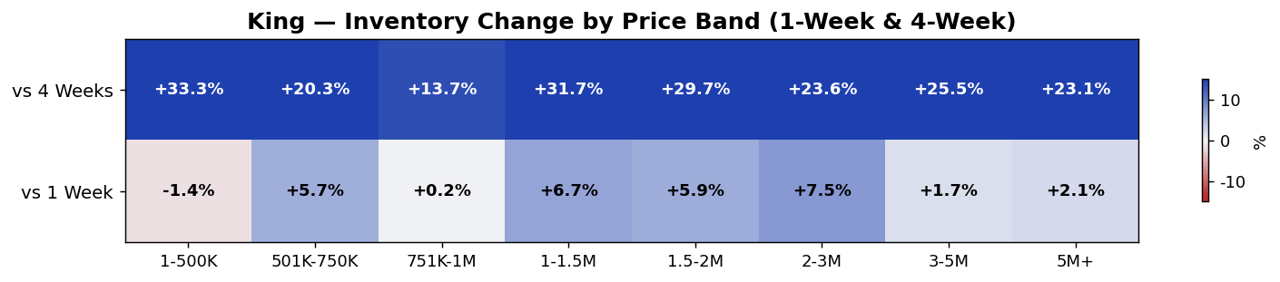
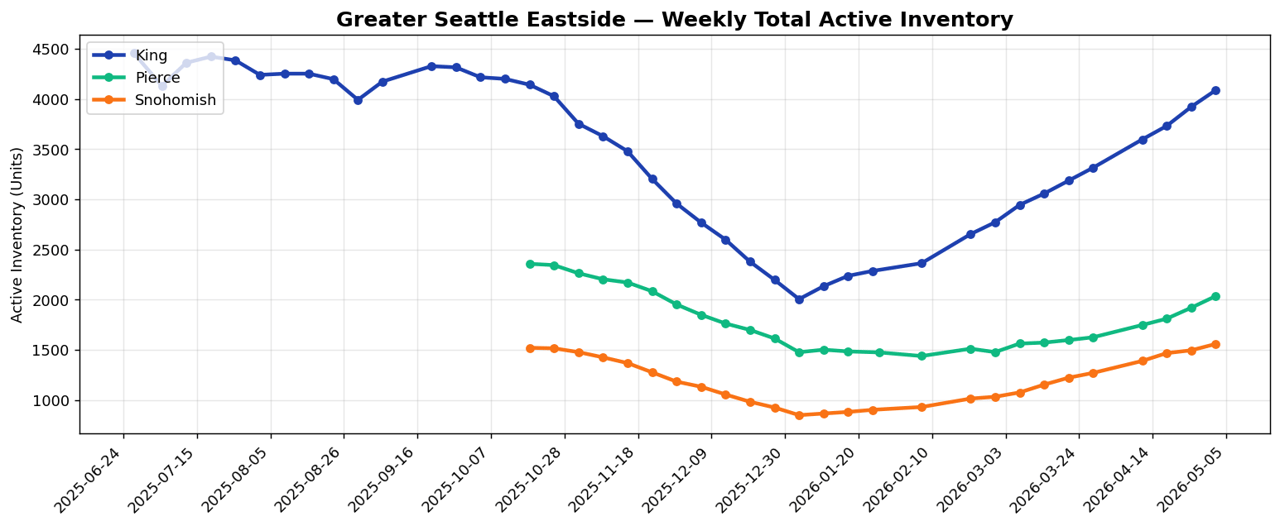
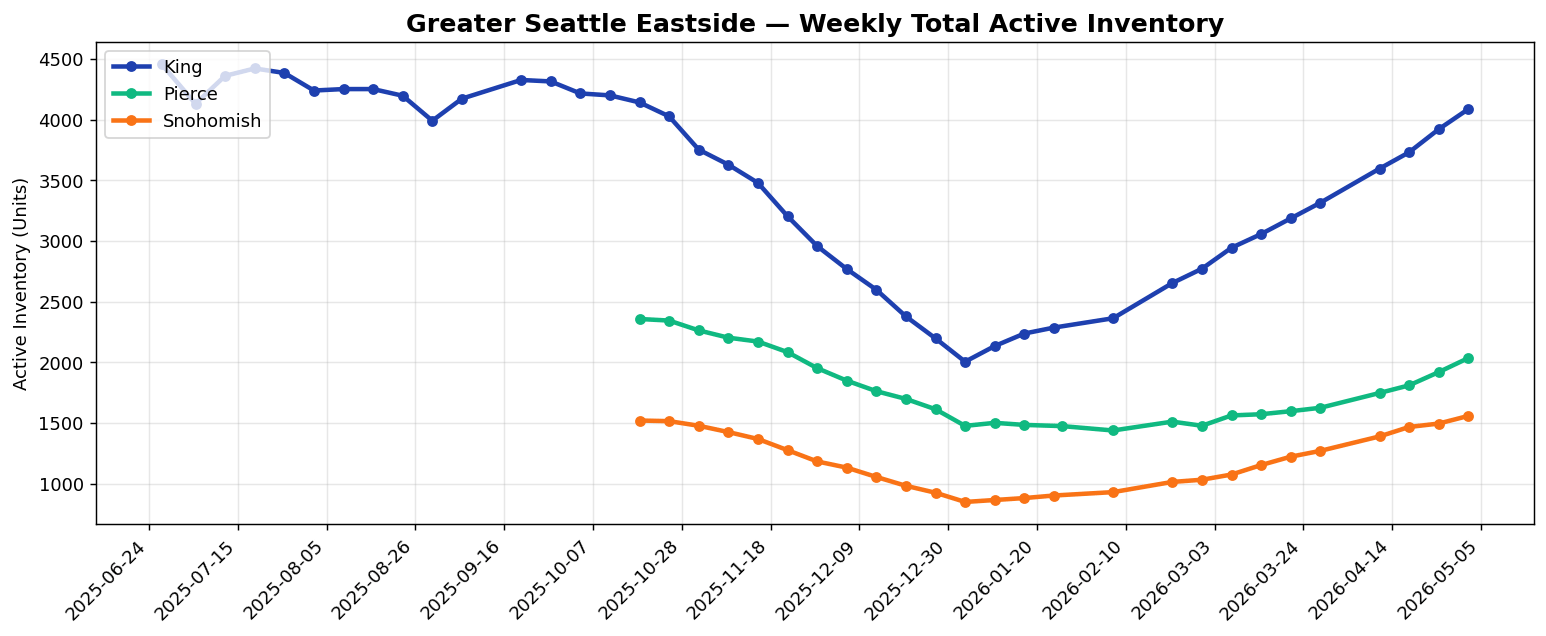
King County single-family active inventory closed the week at 4,088 listings (+4.2% WoW, +23.3% over four weeks) against an absorption ratio of 1.00. The headline read: Supply and demand near equilibrium — micro-segment dynamics dominate. What follows is a working brief for Xceed Realty agents and any Eastside professional who prices, prospects, or advises on this market.
1. Headline numbers
Combined three-county SFH active inventory: 7,683 units. King County is now +103.8% above its trailing trough of 2,006 and -8.3% off its trailing peak of 4,457. The seasonal supply build is on schedule.
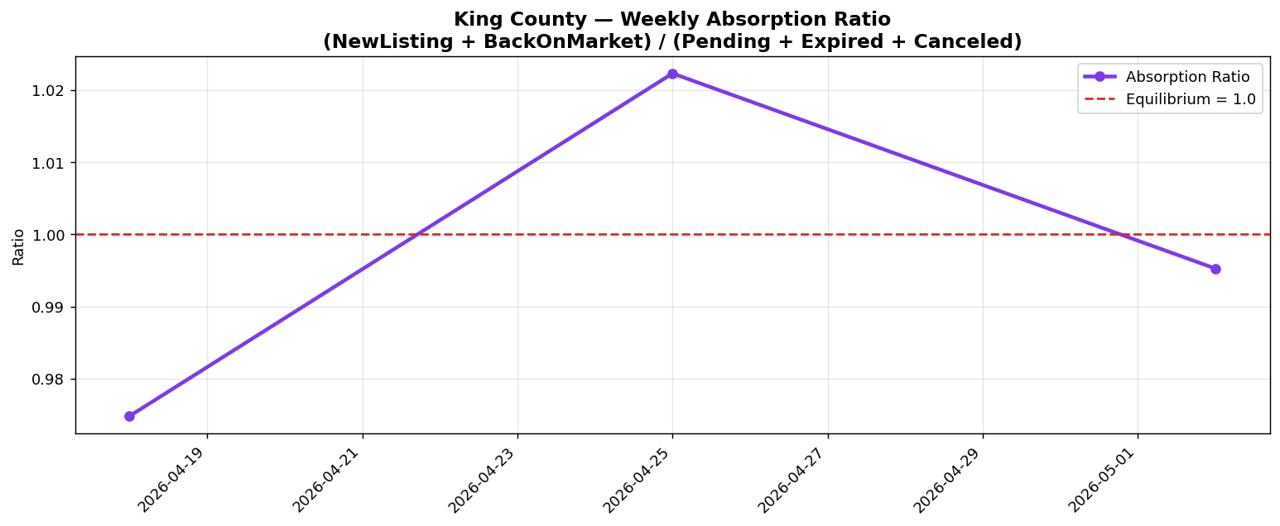
2. Weekly flow & absorption — the signal that matters
Headline inventory is a stock measure; the more useful signal is the flow. King County SFH last seven days:
- 785 new listings (vs 725 prior, ▲8.3%) · 54 back-on-market
- 607 went pending · 457 closed
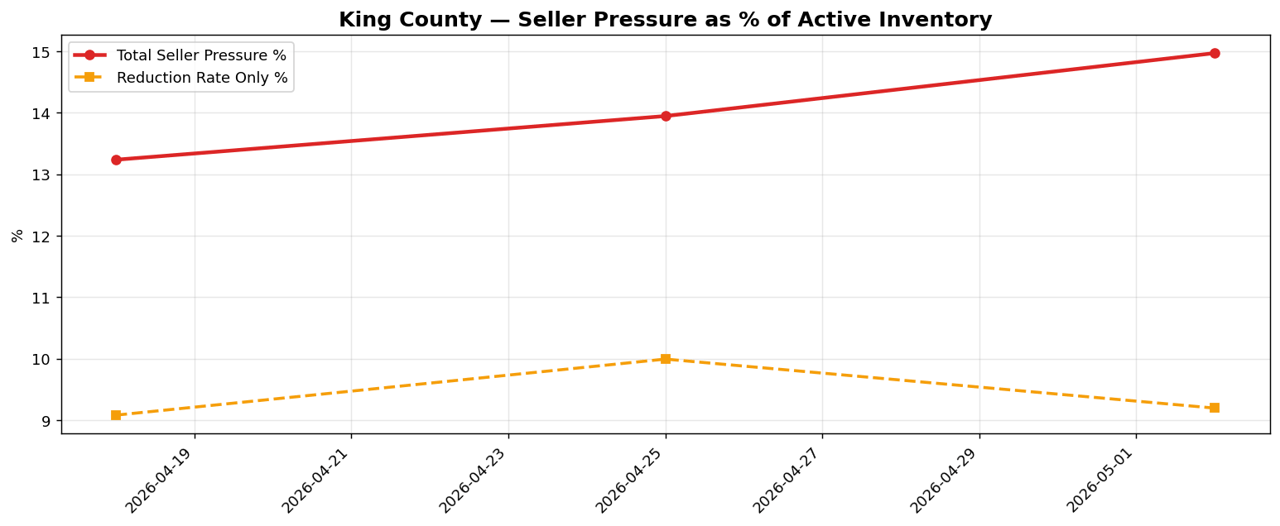
- 376 price reductions = 9.2% of active inventory
- 71 expired · 165 canceled
Absorption = (NewListing + BackOnMarket) ÷ (Pending + Expired + Canceled)
= (785 + 54) ÷ (607 + 71 + 165)
= 1.00
Why this beats NewListing÷Sold: closings reflect deals struck weeks ago. The numerator/denominator above measure THIS week's net supply pressure. A reading near 1.0 means the system clears what comes in. Watch for two consecutive weeks above 1.10 — leading indicator for DOM lengthening.

Total seller-pressure stack at 15.0%. Benchmark: under 20% normal, 20-30% friction, over 30% genuine distress.
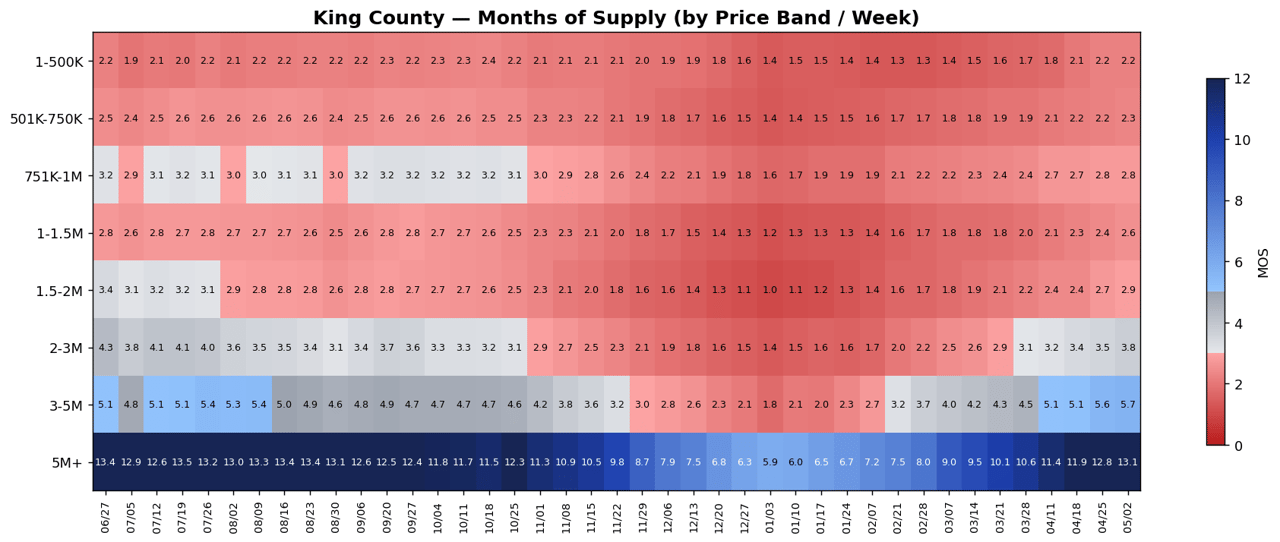
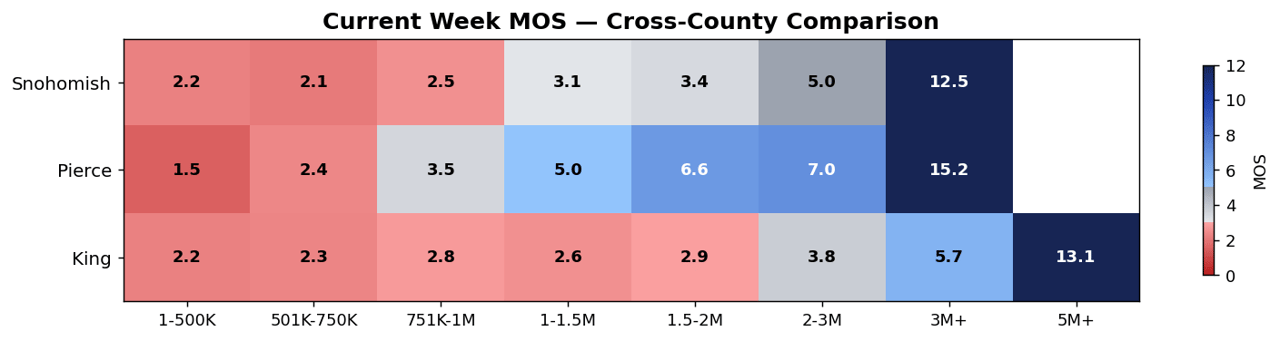
3. County-level Months of Supply
MOS = current active inventory ÷ trailing 12-month average monthly closings. 0–3 sellers' / 3–6 balanced / 6+ buyers'.
King — segment dispersion is wider than the headline

Hottest 1-500K at 2.2 MOS — listing-side leverage. Coolest 5M+ at 13.1 MOS, where DOM runs longer.

Pierce — entry-level remains the region's tightest segment
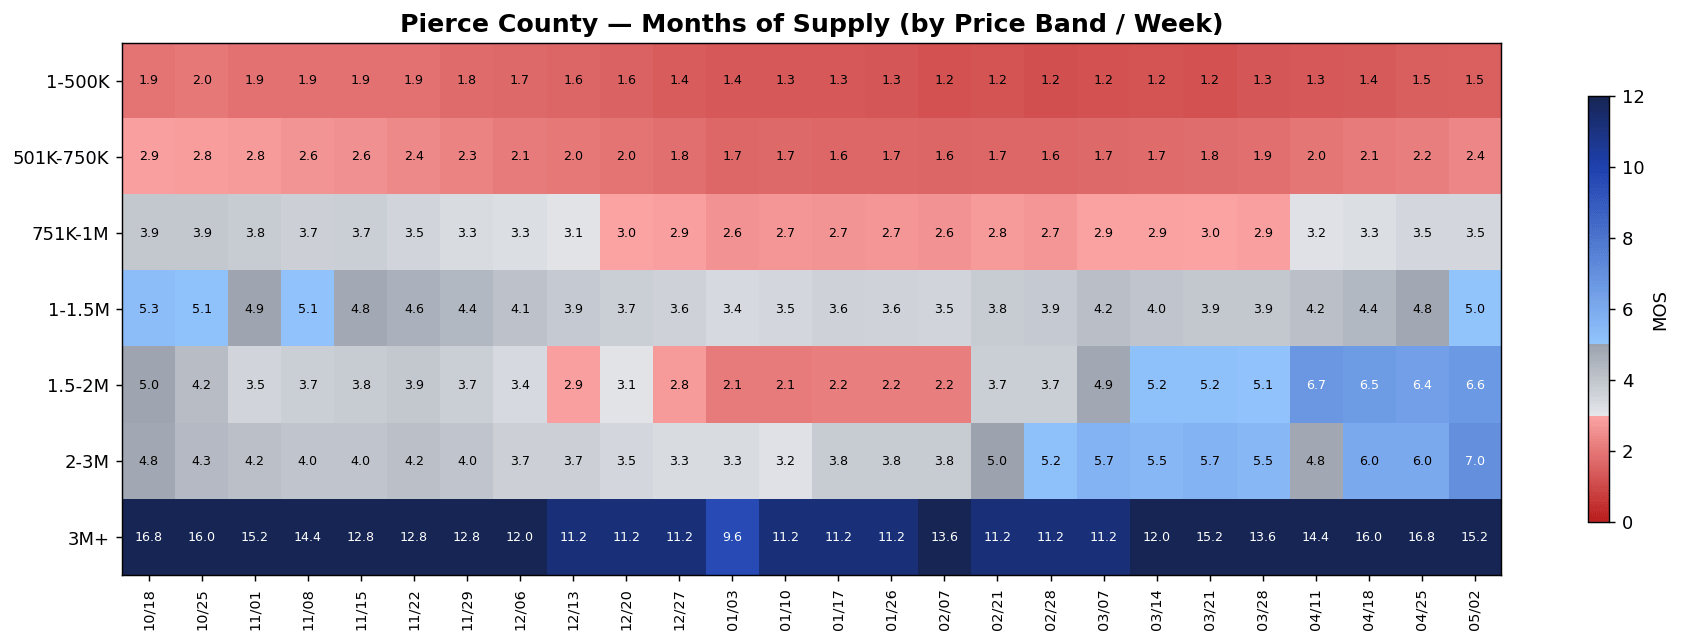
1-500K sits at 1.5 MOS — first-time-buyer demand exceeds listing flow. Luxury tail at 3M+ (15.2 MOS).
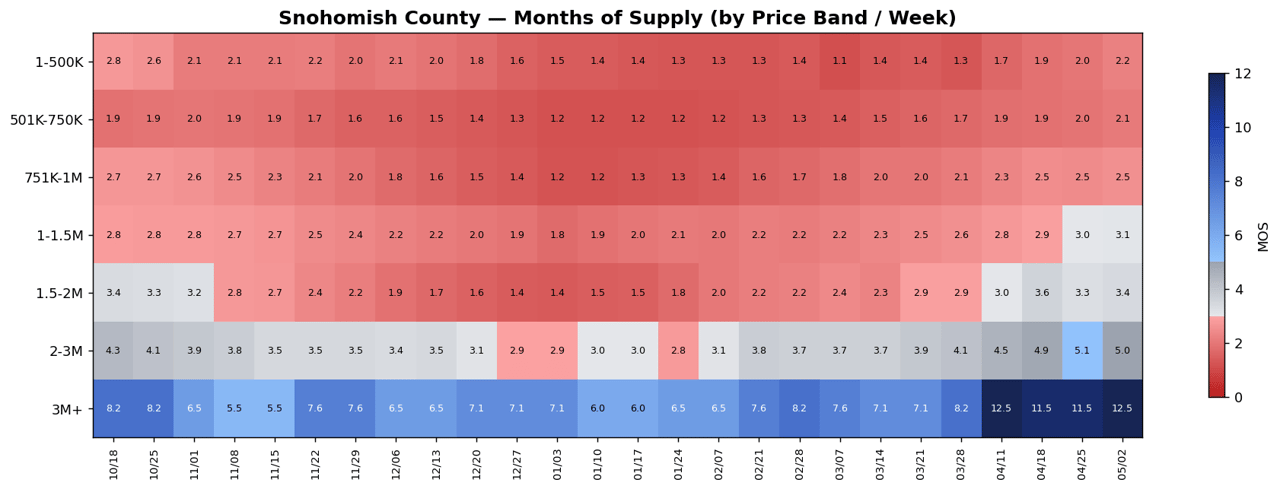
Snohomish — broadly seller-tilted

501K-750K at 2.1 MOS leads.
4. Area-level MOS — Eastside zoom
NWMLS Area code resolution. Of 35 King + Snohomish areas:
- 21 areas in sellers' territory (MOS < 3)
- 12 areas balanced (3–6)
- 2 areas buyer-tilted (6+)
Hottest 5 — listing leverage strongest
- Area 310 · Auburn — MOS 1.2 (64 active / 615 sold trailing 12 mo)
- Area 350 · Renton/Highlands — MOS 1.5 (74 active / 574 sold trailing 12 mo)
- Area 320 · Black Diamond/Maple Valley — MOS 1.7 (114 active / 827 sold trailing 12 mo)
- Area 120 · Des Moines/Redondo — MOS 1.7 (45 active / 322 sold trailing 12 mo)
- Area 100 · Jovita/West Hill — MOS 1.7 (46 active / 316 sold trailing 12 mo)
Coolest 5 — buyer-side opportunity
- Area 520 · Bellevue/West of 405 — MOS 8.3 (147 active / 213 sold trailing 12 mo)
- Area 360 · Skyway Area — MOS 9.1 (117 active / 155 sold trailing 12 mo)
5. Condo segment — quick read
King condo active 2,209 (Pierce 219 · Snohomish 407). Median price points sit lower; absorption is more rate-sensitive (HOA + rate stack). Downtown urban areas (701 Belltown, 390 Central) typically carry higher MOS than suburban Eastside condo product.
6. Agent playbook — what to do this week
Listing-side
- If listing in Auburn, price at-or-just-under recent comps; expect multiple offers within first weekend.
- If listing in a buyer-tilted area (MOS 6+), front-load presentation; build a 2-week price-revisit checkpoint into the listing agreement.
- Quotable: "1 in 10 listings already reduced this week." Clients hear that better than absolute numbers.
Buyer-side
- Inventory is at a 4-week peak — best selection of the quarter.
- Entry-level (1-500K): pre-approval clean, escalation strategy ready.
- Upper-mid (1.5-2M, 2-3M) where MOS loosens: harder negotiation on inspection and closing terms.
7. FAQ
Why absorption ratio instead of NewListing ÷ Sold?
Closings are lagging — they reflect deals priced 30-60 days earlier. The absorption identity uses this-week pendings, expirations, and cancellations as the denominator, capturing real-time absorption against this-week supply. It's a leading indicator for DOM and pricing-power shifts.
What's MOS and why does it matter?
MOS = current active inventory ÷ trailing 12-month average monthly closings. Under 3 = listing-side leverage; 3–6 = balanced; 6+ = buyer-side leverage. Aggregate numbers mask the dispersion that determines pricing strategy — that's why we slice by price band and area.
For Xceed Realty agents and industry peers
This brief is published weekly as a working tool. Xceed agents - reply for a custom slice (specific area, price band, or buyer/seller pitch). Industry peers - door is open for note-comparing.
Ryan Xu · Xceed Realty · Greater Seattle Eastside · [email protected]
中文版本 · Chinese Version Below
发布于 2026年05月02日 · Ryan Xu w/ Xceed Realty · 阅读约 6 分钟
大西雅图东区独立屋市场周报 — 2026年05月02日:King 库存 4,088 套,吸纳率 1.00
King County 独立屋活跃库存本周收于 4,088 套(环比 +4.2%,近 4 周累计 +23.3%),周吸纳率 1.00。一句话总结:供需接近平衡 — 关键看细分市场动态。本期内容是给 Xceed Realty 经纪人 + 任何在东区做定价、拓展、咨询业务的同行的工作简报。
一、本周关键数字
三 county 独立屋活跃库存合计 7,683 套。King County 当前比年内低位 2,006 套高 +103.8%,比年内峰值 4,457 套低 8.3%。季节性供给反弹节奏正常。

二、周内流量与吸纳率 — 真正有信号意义的指标
"库存"是存量数据;"流量"才是市场温度的实时信号。King County 独立屋过去 7 天:
- 785 套新上市(上周 725,▲8.3%)· 54 套重新上市
- 607 套进入合同 · 457 套成交
- 376 套降价 = 占活跃库存的 9.2%
- 71 套过期 · 165 套取消
吸纳率 = (新上市 + 重新上市) ÷ (进入合同 + 过期 + 取消)
= (785 + 54) ÷ (607 + 71 + 165)
= 1.00
为什么这个比"新上市 ÷ 成交量"更准:成交量反映的是 30-60 天前定价的交易,是滞后指标。上面的分子分母衡量的是本周的净供给压力。读数接近 1.0 表示系统正好消化掉新增供给。如果连续两周高于 1.10,是 DOM(市场在售天数)开始拉长的领先信号。


综合卖方压力指数 15.0%。基准:低于 20% 正常,20-30% 摩擦,超过 30% 真正承压。
三、County 级 MOS 数据
MOS = 当前活跃库存 ÷ 过去 12 个月月均成交量。0–3 卖方市场 / 3–6 均衡 / 6+ 买方市场。

King — 价位段分化大于总量
最热价位段 1-500K,MOS 2.2(卖方议价权强);最冷 5M+,MOS 13.1(DOM 拉长,需要更精细的营销)。
Pierce — 入门段仍是全区最紧

1-500K 段 MOS 1.5 — 首次置业需求超过供给。豪宅段 3M+ 为 15.2 MOS。
Snohomish — 整体偏卖方

501K-750K 段 2.1 MOS 领跑。
四、Area 级 MOS — 东区聚焦
按 NWMLS Area 编号细分。本周跟踪的 35 个 King + Snohomish Area:
- 21 个属卖方市场(MOS < 3)
- 12 个均衡(3-6)
- 2 个偏买方(6+)
最热 5 个区 — 卖方议价权最强
- Area 310 · Auburn — MOS 1.2 (64 在售 / 过去 12 个月成交 615)
- Area 350 · Renton/Highlands — MOS 1.5 (74 在售 / 过去 12 个月成交 574)
- Area 320 · Black Diamond/Maple Valley — MOS 1.7 (114 在售 / 过去 12 个月成交 827)
- Area 120 · Des Moines/Redondo — MOS 1.7 (45 在售 / 过去 12 个月成交 322)
- Area 100 · Jovita/West Hill — MOS 1.7 (46 在售 / 过去 12 个月成交 316)
最冷 5 个区 — 买方机会窗口
- Area 520 · Bellevue/West of 405 — MOS 8.3 (147 在售 / 过去 12 个月成交 213)
- Area 360 · Skyway Area — MOS 9.1 (117 在售 / 过去 12 个月成交 155)
五、Condo 公寓板块速览
King 公寓活跃 2,209(Pierce 219 · Snohomish 407)。中位价位段更低;吸纳率对利率更敏感(HOA 费 + 月供叠加)。市中心区域(701 Belltown、390 Central Seattle)的 MOS 通常高于东区郊区公寓。
六、经纪人行动手册 — 这周怎么打
Listing 方
- 在 Auburn 上市,定价对齐近期成交(或略低),首个周末就能多人争抢。
- 买方市场区域(MOS 6+)上市要前置准备 staging + 营销,listing agreement 里直接锁定 2 周价格复审节点。
- 给客户的金句:"本周每 10 套在售里就有 1 套已经降价了。"客户对比例的感知比对绝对数字强很多。
Buyer 方
- 当前库存是季度内峰值 — 选择面最宽。
- 入门段(1-500K):贷款预批必须干净,escalation clause 准备好。
- 中高端(1.5-2M、2-3M)MOS 在松动 — 检查条款 + 关闭日期都可以更激进谈。
七、常见问题
为什么用吸纳率而不是"新上市 ÷ 成交量"?
成交量是滞后指标 — 反映 30-60 天前定的价。本文用的吸纳率分母是本周的进入合同、过期、取消三项之和,分子是本周新上市 + 重新上市,衡量的是当下的实时供需平衡。是 DOM 和定价权变化的领先指标。
MOS 是什么?怎么用?
MOS = 当前活跃库存 ÷ 过去 12 个月月均成交量。低于 3 = 卖方议价权强;3-6 = 均衡;6+ = 买方议价权强。我们按价位段和 Area 切分是因为:总量数字会掩盖真正决定定价策略的细分差异。
致 Xceed Realty 团队 + 行业同行
本周报每周发布作为工作工具。Xceed 经纪人 - 回复本文要 custom slice(具体 Area、价位段、买/卖方 pitch 角度)。同行 - 欢迎对话交流。
Ryan Xu · Xceed Realty · 大西雅图东区 · [email protected]